FIGURE 4.

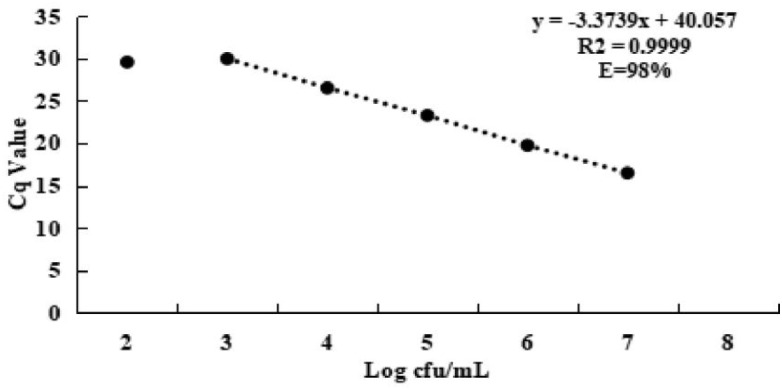
Standard curve for S. agalactiae of SDS–PMA–qPCR assay, plotted values represented the mean value and standard deviations obtained from three triplicate tests. Cq = threshold cycle. Color version available online.

Standard curve for S. agalactiae of SDS–PMA–qPCR assay, plotted values represented the mean value and standard deviations obtained from three triplicate tests. Cq = threshold cycle. Color version available online.