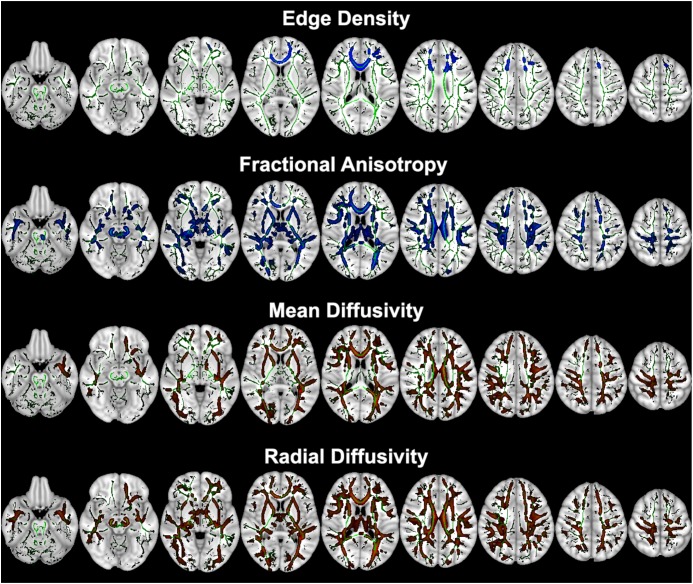
FIGURE 1.
Tract-Based Spatial Statistics (TBSS) voxel-wise analysis of ED and diffusion tensor metrics between children with AOR (n = 15) versus those without (n = 24). The voxels from white matter tracts with significant difference between the two study groups are overlaid on mean skeletonized FA averaged from all aligned FA maps (green). Children with AOR had lower white matter tract ED and FA (colored blue) but higher MD and RD (colored red) compared to those without. The Supplementary Table S1 lists the white matter tracts with significant voxel-wise difference between two study groups. Of note, images are depicted in radiological view (i.e., left hemisphere on the right). AOR, Auditory over-responsivity; ED, Edge Density; FA, Fractional Anisotropy; MD, Mean Diffusivity; RD, Radial Diffusivity; TBSS, Tract-based spatial statistics.

