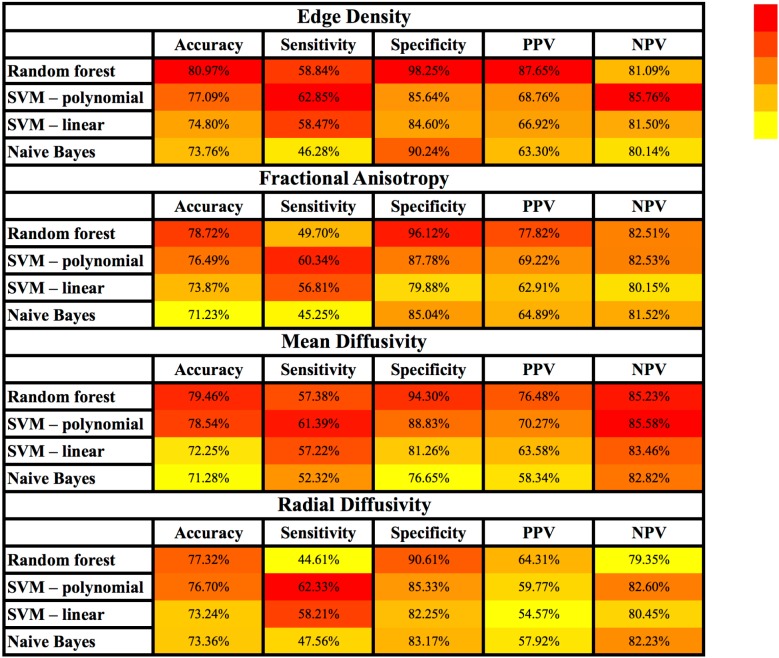
FIGURE 3.
Heatmap depiction of different supervised machine-learning models applied for classification of children with AOR. Of note, the color tone is applied for each column separately to facilitate visual comparison of each test characteristic (e.g., sensitivity) among different models. Each cell represents the average performance of corresponding machine-learning algorithm among × 500 stratified randomly selected validation samples (details in Supplementary Table S2). Among different combinations of machine learning models and connectivity metrics, the combination of “Edge Density” with random forest models yields the highest accuracy, specificity and PPV; whereas polynomial SVM yielded the highest sensitivity and NPV. AOR, Auditory over-responsivity; NPV, negative predictive value; PPV, positive predictive value; SVM, Support Vector Machine.

