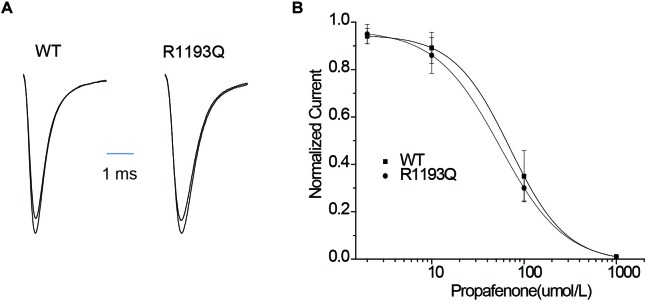
FIGURE 3.
(A) Whole-cell current recordings of TB before and after propafenone perfusion (10 μmol/L). (B) Concentration dependence of TB by propafenone. Graph showed a peak current after drug application normalized to peak current in the absence of drug plotted against a function of drug concentration. IC50 values were 70.3 ± 9.3 μmol/L for WT (n = 6) and 54.9 ± 10.1 μmol/L for R1193Q (n = 6), respectively.

