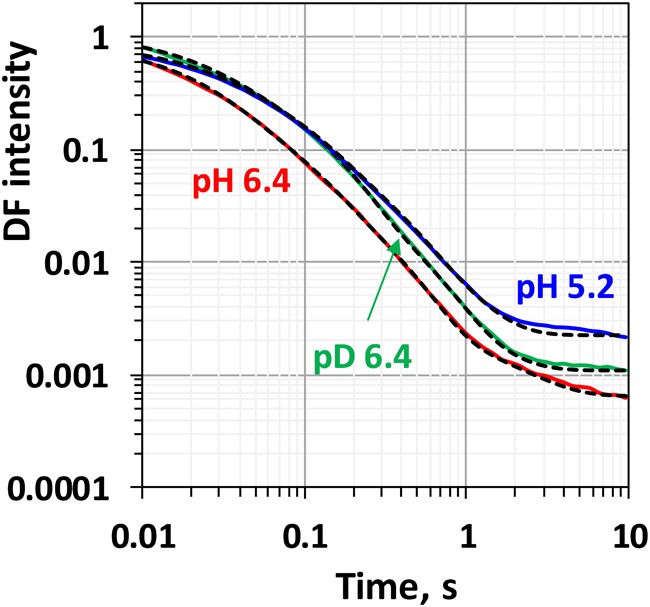
FIGURE 6.

Delayed fluorescence decays measured after the second flash at 20°C in H2O buffer with pH 6.4 (red line), pH 5.2 (blue line) and in D2O buffer with pD 6.4 (green line). Black dashed lines represent the simulated curves according to Eq. 2.1 within the joint fit simulation approach. Simulation parameters are shown in Table 2, Figure 7, 8 and Supplementary Figure S5.
