
Figure 1.
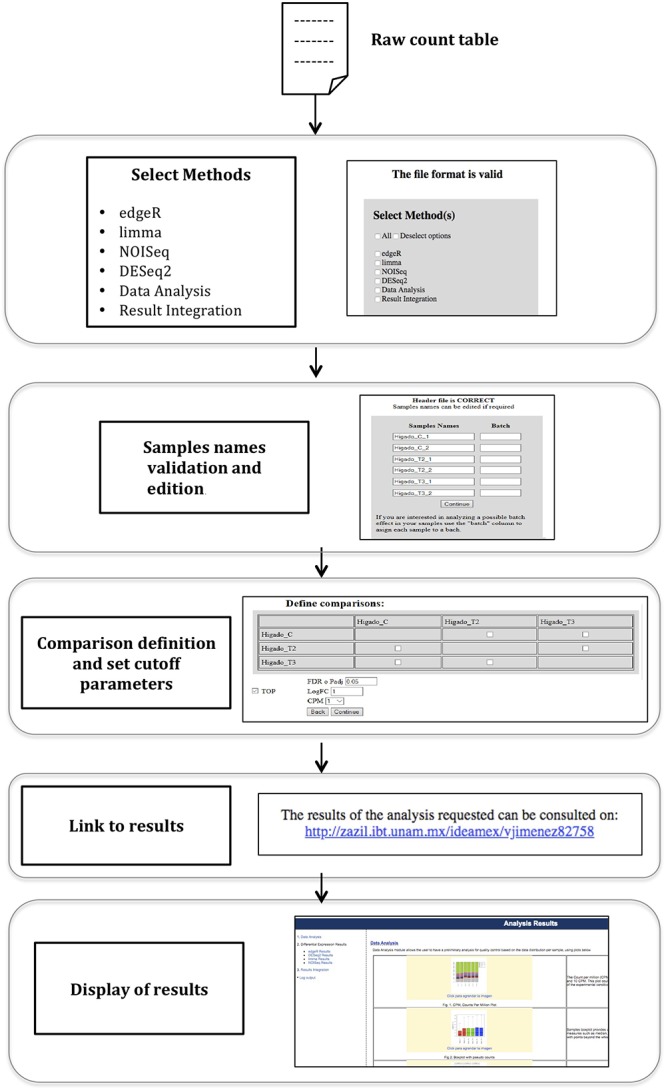
IDEAMEX workflow diagram. The web server workflow starts with the loading and validation of the raw count table as input. Then, the user selects one or more methods for differential expression analysis, data analysis and results integration. An optional step to edit the sample names is available. The user designs the comparison matrix by selecting which conditions will be compared. A link to the results is generated and after a few minutes, the results are presented in the Analysis Results web page.