
Figure 3.
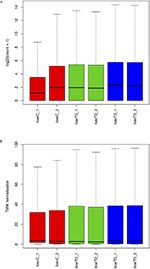
Boxplot with normalized counts. The frequency distribution and some statistics like mean, median and outliers are represented in these plots. (A) log2 normalized counts. (B) TMM normalized counts.
Official websites use .gov
A
.gov website belongs to an official
government organization in the United States.
Secure .gov websites use HTTPS
A lock (
) or https:// means you've safely
connected to the .gov website. Share sensitive
information only on official, secure websites.
Boxplot with normalized counts. The frequency distribution and some statistics like mean, median and outliers are represented in these plots. (A) log2 normalized counts. (B) TMM normalized counts.