Figure 8.

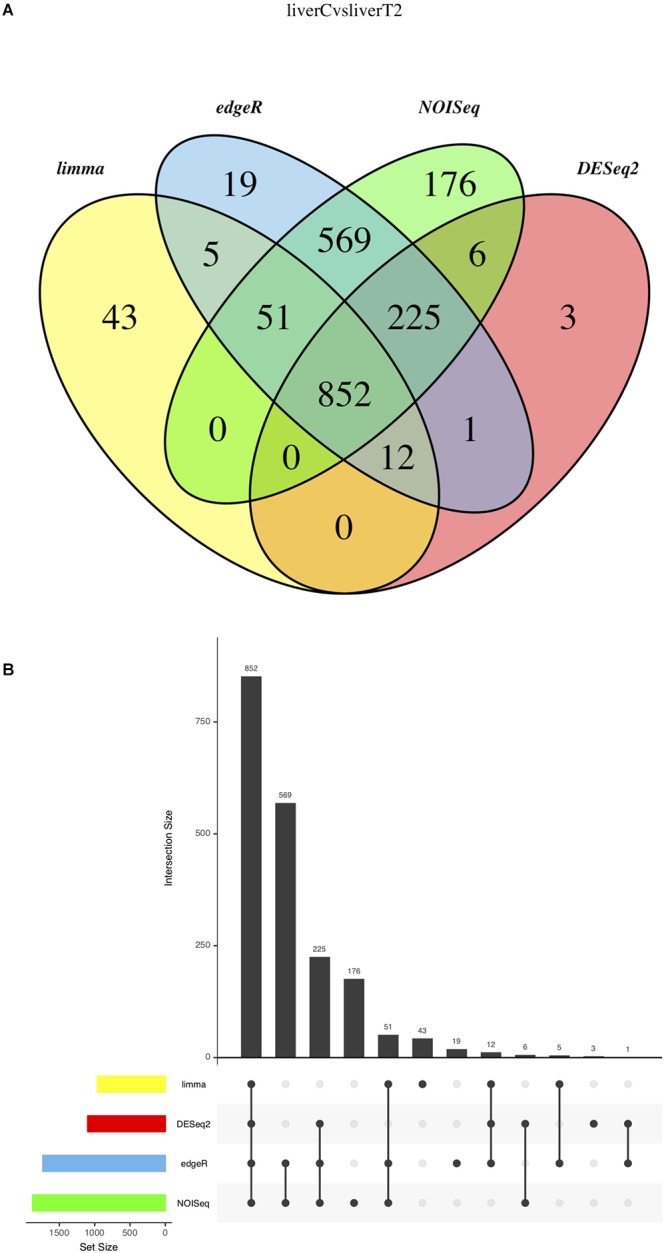
Result Integration summary. (A) Venn diagram representing the result intersection for each selected method. (B) Upset plot representing the contribution of each selected method.

Result Integration summary. (A) Venn diagram representing the result intersection for each selected method. (B) Upset plot representing the contribution of each selected method.