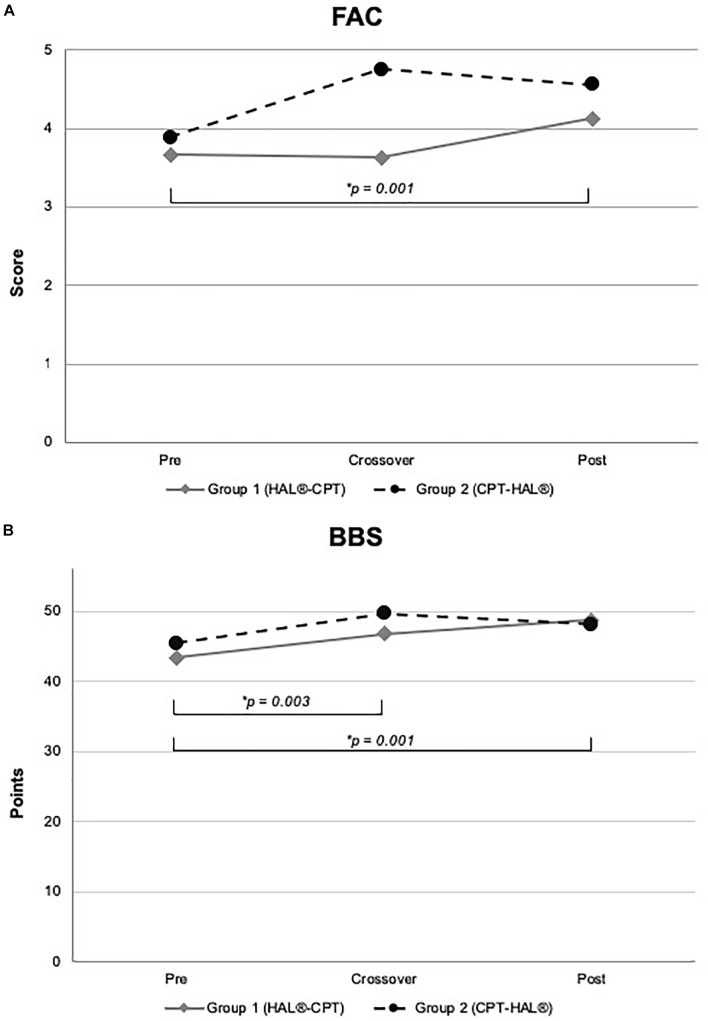
FIGURE 4.
Functional outcome and Berg-Balance Scale. Figure shows mean values for Group 1 (HAL-CPT) and Group 2 (CPT-HAL). FAC = Functional ambulation categories (A), BBS = Berg-Balance-Scale (B). ∗ indicated post hoc t-tests after significant effect for factor “time.” p-threshold < 0.017 (Bonferroni correction).

