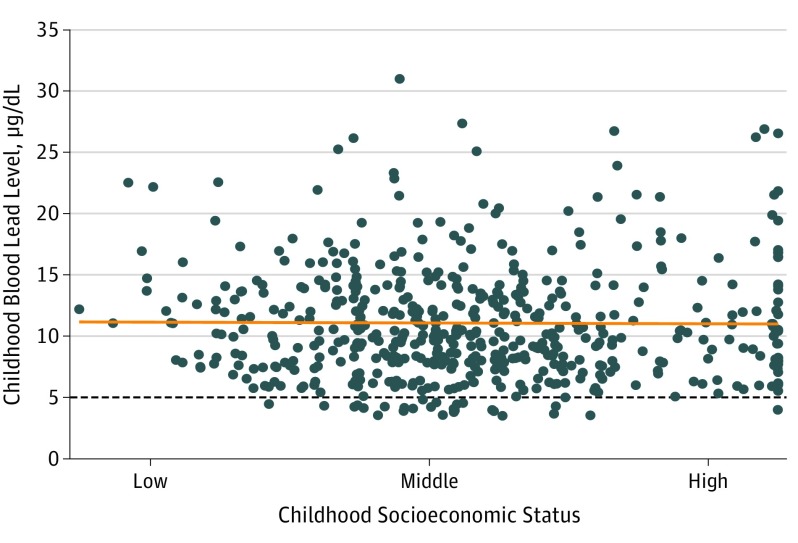
Figure 1. Association of Childhood Blood Lead Level at 11 Years of Age With Child Family Socioeconomic Status.
There was no significant social gradient in lead exposure in the Dunedin study children (r = −0.01; 95% CI, −0.08 to 0.07; P = .86); high blood lead levels were observed among children from all socioeconomic status groups. Childhood socioeconomic status was determined through the 6-point Elley-Irving scale (categories 1 and 2 [low status], 3 and 4 [middle status], and 5 and 6 [high status]), which codes the occupations and associated income and educational levels of members’ parents. The orange line depicts the nonsignificant association between child blood lead levels and childhood socioeconomic status. The dotted line depicts the current Centers for Disease Control and Prevention child blood lead level reference value for clinical attention (5 μg/dL).3 A total of 554 (94.0%) tested study members had blood lead levels above the current reference value.

