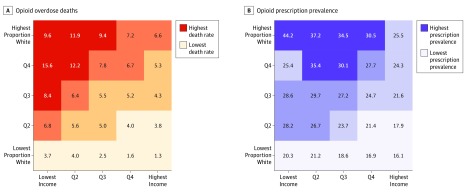
Figure 1. Opioid Overdose Deaths and Prescription Prevalence.
A, Annual age-standardized opioid overdose death rates per 100 000 people. B, Annual prevalence of receiving at least 1 prescription for an opioid among individuals 15 years or older. Both figures represent the entire state of California, showing quartiles of mean annual rates during the 2011 through 2015 study period. The y-axis represents the percentage of individuals in each zip code tabulation area identifying as non-Hispanic white, by quintiles (Qs). The x-axis represents quintiles of the mean per capita annual income at the zip code tabulation area level. Values for all 25 quintile-quintile pairs are shown with color and text.

