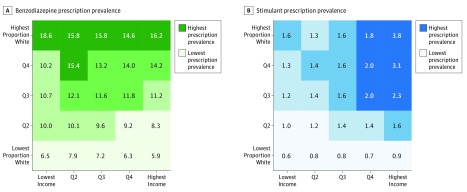
Figure 2. Benzodiazepine and Stimulant Prescription Prevalences.
Annual prevalence of receiving at least 1 prescription for a benzodiazepine (A) or a stimulant (B). Both figures represent the entire state of California, showing quartiles (Qs) of mean annual rates during the 2011 through 2015 study period. A, Values for all individuals 15 years or older. B, Data for all individuals of any age because stimulant prescription receipt is highest in the age group of 10 to 14 years.

