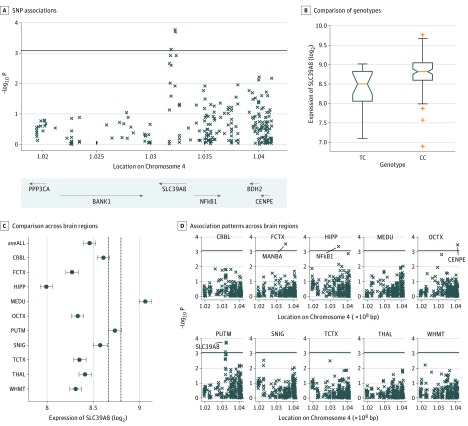
Figure 2. Gene Expression of SLC39A8 at Putamen and Gray Matter Volume at Putamen Shared Common Genetic Controls.
A, Significance level of associations between single-nucleotide polymorphism (SNP) rs13107325 and gene expression levels of nearby genes of SLC39A8 (the probes used by Affymetrix were organized according to locations of their starting base at chromosome 4). B, Comparison between gene expression levels of SLC39A8 at putamen with different genotypes at SNP rs13107325. C, Comparison on gene expression levels (mean value and 95% confidence interval) of SLC39A8 across 10 brain regions, including inferior olivary nucleus (MEDU; subdissected from the medulla), putamen (PUTM; at the level of the anterior commissure), substantia nigra (SNIG), cerebellar cortex (CRBL), thalamus (THAL; at the level of the lateral geniculate nucleus), temporal cortex (TCTX), intralobular white matter (WHMT), occipital cortex (OCTX), frontal cortex (FCTX), and hippocampus (HIPP). D, Association patterns between SNP rs13107325 and gene expressions in 10 brain regions. Genes with significant associations (P < .0008, calculated by 0.05/10/6 by Bonferroni correction) were labeled with gene names. bp Indicates base pairs.

