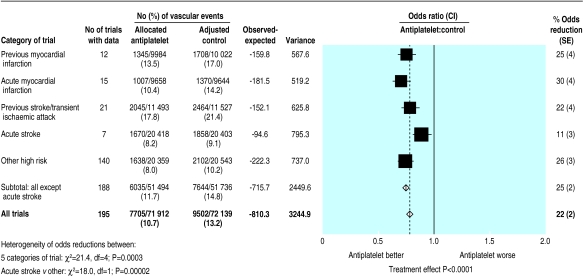
Figure 1.
Proportional effects of antiplatelet therapy on vascular events (myocardial infarction, stroke, or vascular death) in five main high risk categories. Stratified ratio of odds of an event in treatment groups to that in control groups is plotted for each group of trials (black square) along with its 99% confidence interval (horizontal line). Meta-analysis of results for all trials (and 95% confidence interval) is represented by an open diamond. Adjusted control totals have been calculated after converting any unevenly randomised trials to even ones by counting control groups more than once, but other statistical calculations are based on actual numbers from individual trials

