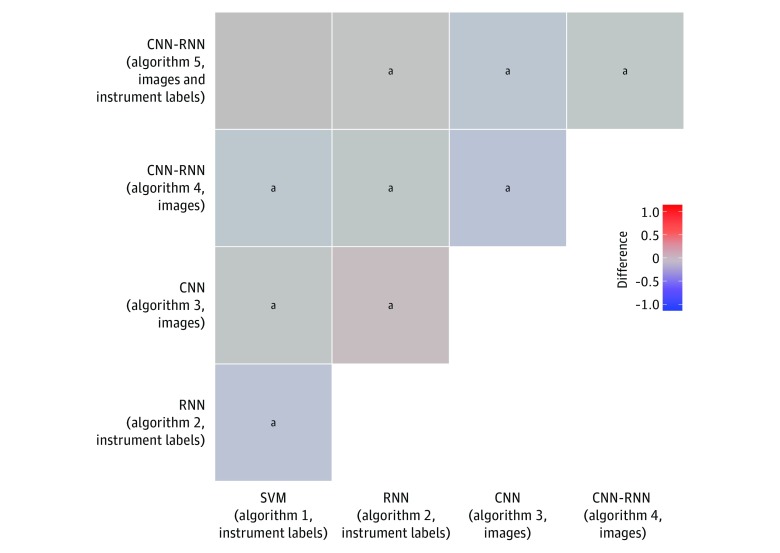
Figure 2. Differences in Area Under the Receiver Operating Characteristic Curve Between Pairs of Algorithms for Phase Classification.
Area under the receiver operating characteristic curve of algorithm in column subtracted from area under the receiver operating characteristic curve of algorithm in row. CNN indicates convolutional neural network; RNN, recurrent neural network; and SVM, support vector machine.
aP = .008.

