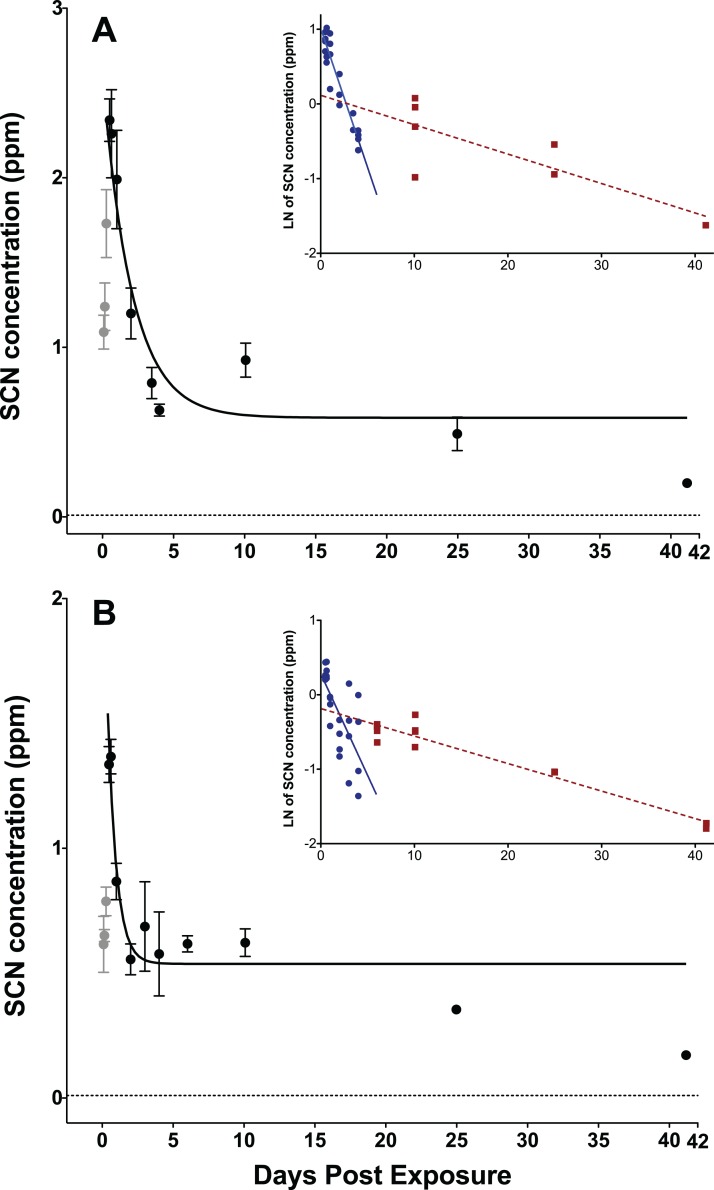
Figure 1. Depuration curves for plasma SCN concentration in Amphiprion ocellaris after exposure to 50 ppm cyanide (CN) for (A) 45 s and (B) 20 s.
In both (A) and (B) the black solid line represents the fit of the data to a single phase exponential decay function. Gray data points represent early time points where SCN plasma levels are increasing and are therefore not included in the fit. Each data point indicates the mean ± S.E. The dashed gray line represents the detection limit. Where no error bar is observed the error is smaller than the data point. Insets are natural log of plasma SCN concentration as a function of time. These data were divided into two groups and linear fits were performed on both the fast (round/solid) and slow (square/dashed) component of SCN elimination. See Table S1 and File 1 for the data of one treatment batch (group 5, 45 s exposure) excluded from plots.

