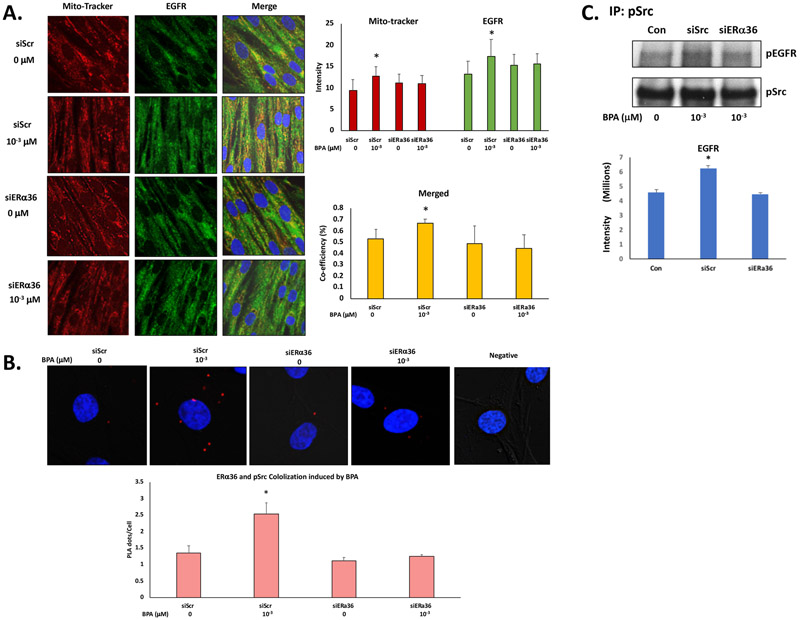
Fig. 6. ERα36, EGFR and phospho-Src were coexpressed and colocalized in ht-UtLM cells treated with BPA.
(A) Representative images of immunofluorescence staining and confocal microscopy taken of ht-UtLM cells treated with BPA (10−3 μM) for 10 min following siERα36 or siScr transfections. EGFR=green, MitoTracker=red, DAPI=blue, and colocalization=yellow, Bar graph of semi-quantitated staining intensity and correlation coefficient of colocalization of MitoTracker and EGFR. (B), Representative images of PLA of ERα36 and phosphorylated Src (pSrc) induced by BPA at 10–3 μM for 10min in siScr and siERα36 transfected ht-UtLM cells. The colocaliztion of ERα36 and pSrc revealed by dots = red. The cells were counterstained with DAPI = blue to show the nuclei. The graph shows mean ±SE of red dots counted in 100 – 200 cells. The PLA dots/cell was significantly higher (*P<0.05) in the cells with functional ERα36 (siScr) treated with BPA compared with controls; however, the level PLA dots/cell was diminished by ERα36 knockdown (siERα36). (C) Coimmunoprecipitation of phospho-EGFR and phospho-Src in ht-UtLM cells treated with BPA (10−3 μM) for 10 min in the presence of siERα36 or siScr, Concentrations of phosphorylated EGFR associated with phospho-Src were significantly higher (P < 0.05) in the cells with functional ERα36 (siScr) treated with BPA compared with controls. However, there was no difference in levels of phosphorylated EGFR associated with phospho-Src compared to control when ERα36 was knocked down (siERα36). The band of coimmunoprecipitation and confocal images shown are representative of three independent experiments and the intensity and correlation coefficients are expressed as mean±SE done in three independent experiments;

