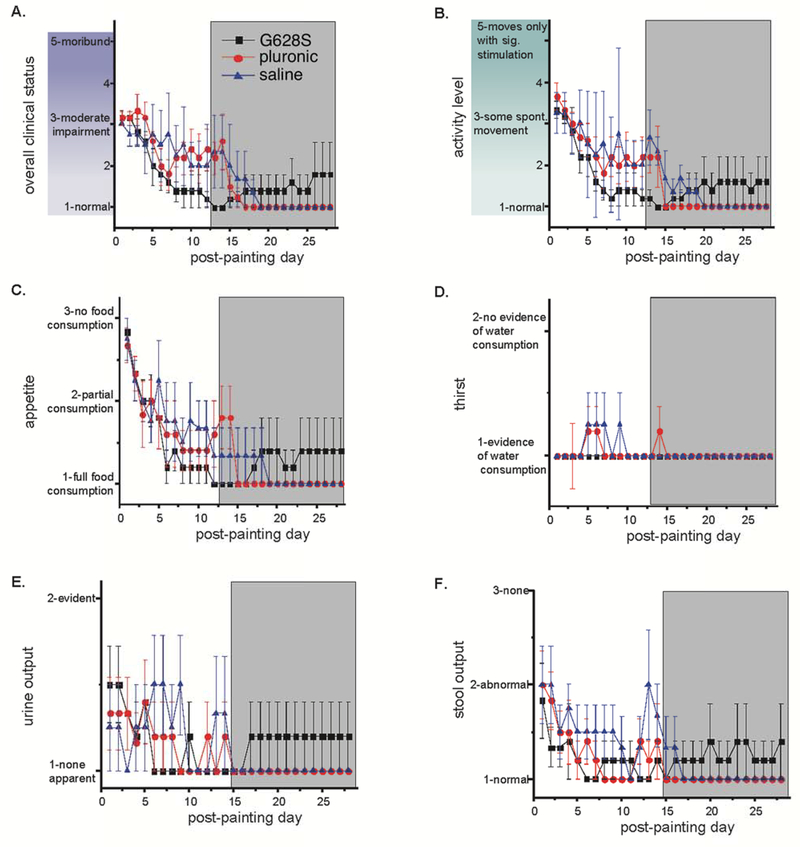
Figure 3:
Clinical observations: daily assessment of (A) overall clinical status, (B) activity, (C) appetite, (D) thirst, (E) urine and (F) stool output was recorded using a 2–5 point numerical scale with guidance from the descriptors shown on the graphs. The investigator evaluating the animals was masked to study group identity of each animal. The G628S group is the black square. The pluronic group is the red circle. The saline group is the blue triangle. There were no statistically significant differences between groups.

