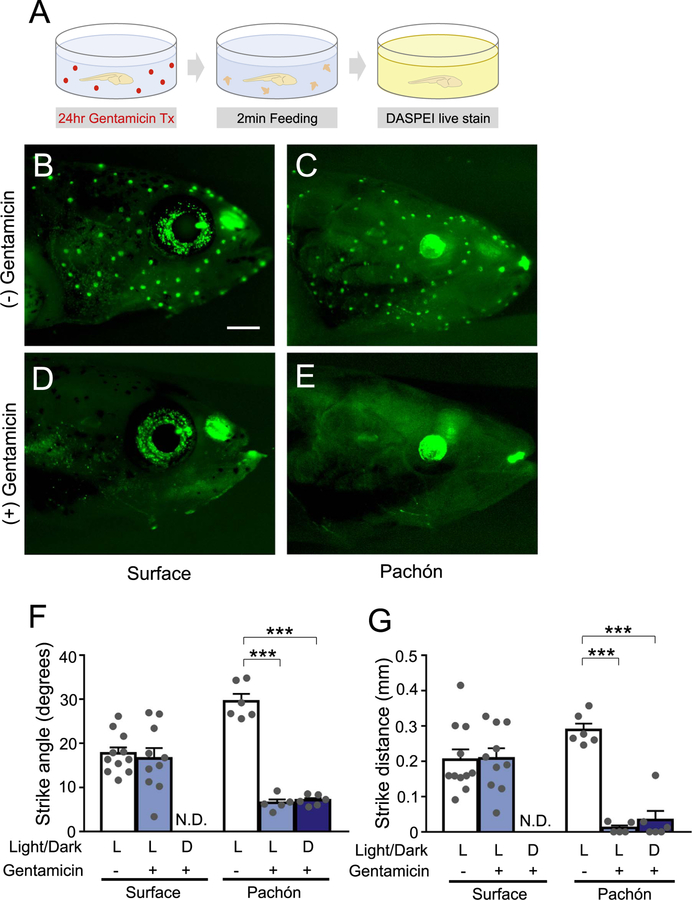
Fig. 3. Ablation of lateral line in Pachón cavefish reduces strike angle and distance.
(A) Diagram of experimental paradigm for gentamicin treatment. Fish are treated for 24 h in dissolved gentamicin sulfate, followed by a 2-min feeding/behavioral recording, and 1 h in a DASPEI solution to confirm complete ablation of neuromasts. (B-E) Visualization of lateral line neuromasts in surface fish (left) and Pachón cavefish (right) before (top) and after (bottom) gentamicin treatment. Scale bar = 0.5 mm. (F) Strike angle of surface fish and Pachón cavefish, with or without prior gentamicin treatment, in lighted or dark conditions. Surface fish control(N = 11) vs. light/gentamicin(N = 10; Unpaired t-test, t = 0.4196, df=19, P = 0.6795). Pachón cavefish control (N = 6) vs. light/gentamicin(N = 5; P < 0.0001). Pachón cavefish control vs dark/gentamicin(N = 6; P < 0.0001; One-Way ANOVA, F(2, 14) = 136.9, P < 0.0001. (G) Strike distance of surface fish and Pachón cave fish, with or without gentamicin treatment, in lighted or dark conditions. Surface fish control(N = 11) vs. light/ gentamicin(N = 10; Unpaired t-test, t = 0.09121, df=19, P = 0.9283). Pachón cavefish control(N = 6) vs. light/gentamicin(N = 5; P < 0.0001). Pachón cavefish control vs. dark/ gentamicin(N = 6; P < 0.0001; One-Way ANOVA, F(2, 14) = 63.46, P < 0.0001. N.D. = No Data/Strikes. Error bars represent + /− standard error of the mean. *** denotes P < 0.001.

