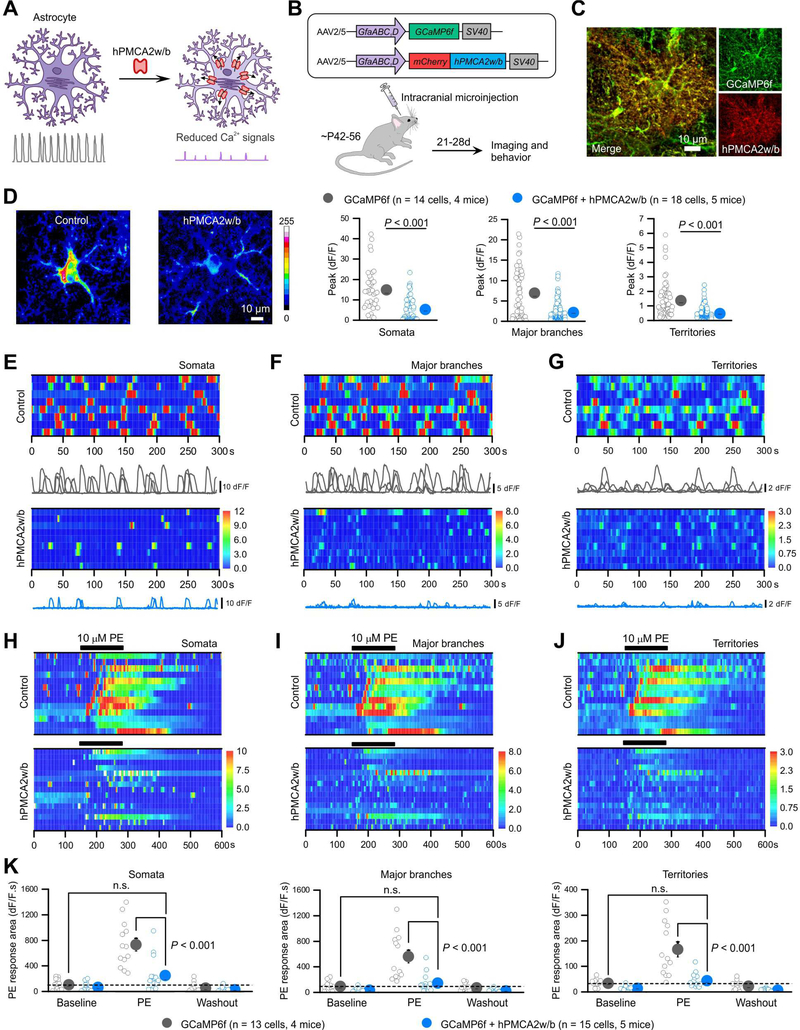
Figure 1: Reducing Ca2+-dependent signaling in striatal astrocytes with hPMCA2w/b.
(A) Schematic of hPMCA2w/b to attenuate Ca2+ signals. (B) AAVs for expressing mCherryh-PMCA2w/b with GCaMP6f in astrocytes. (C) IHC images showing colocalization of GCaMP6f and hPMCA2w/b in striatal astrocytes (Figure S2). (D) Z-stack images of GCaMP6f-expressing striatal astrocytes for control and hPMCA2w/b mice. Bar graphs: peak amplitude of spontaneous Ca2+ signals in somata, major branches and territories of striatal astrocytes (Mann-Whitney tests). (E-G) Kymographs and ΔF/F traces of Ca2+ signals in somata (E), major branches (F) and territories (G) of control and hPMCA2w/b-expressing astrocytes. (H-J) Kymographs of cells with Ca2+ responses evoked by phenylephrine (PE, 10 μM) in somata (H), major branches (I) and territories (J) of control and hPMCA2w/b-expressing astrocytes. (K) Summary plots for experiments in H-J. Average data are shown as mean ± SEM. In some cases the SEM symbol is smaller than the symbol for the mean.

