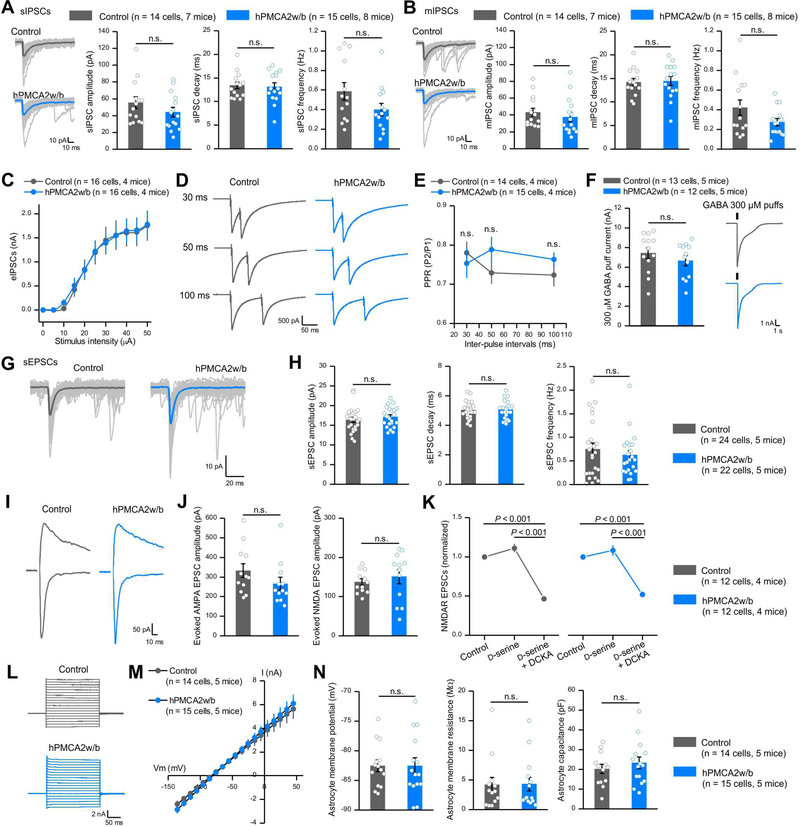
Figure 4: Reducing striatal astrocyte Ca2+-dependent signaling in vivo did not affect fast synaptic transmission or astrocyte properties.
(A) Left, individual and average traces of thirty sIPSCs from control and hPMCA2w/b mice. Right, amplitude, decay time, and frequency of sIPSCs recorded from MSNs. (B) Left, individual and average traces of thirty mIPSCs from control and hPMCA2w/b-expressing mice. Right, mIPSC amplitude, decay time and frequency. (C) Evoked IPSCs from control and hPMCA2w/b mice. (D-E) Representative traces and average data for evoked IPSCs due to paired stimuli in control and hPMCA2w/b mice. (F) Traces and average data for currents evoked by 300 μM GABA puffs for control and hPMCA2w/b. Data in A-F were assessed with Student’s t or Mann-Whitney tests. (G,H) Traces (G) and average data (H) for sEPSCs in control and hPMCA2w/b mice. (I, J) Traces and average data for AMPA and NMDA receptor-mediated evoked EPSCs. AMPA EPSCs were measured at −70 mV and NMDA EPSCs were measured at +40 mV, 50 ms after the stimulus. (K) Normalized NMDA receptor-mediated evoked EPSCs. Responses to D-serine and DCKA were indiscernible for control and hPMCA2w/b- mice. (L) Current waveforms from astrocytes during 10 mV voltage jumps from - 140 mV to 40 mV. (M) Average current-voltage relations. (N) Average data for astrocyte membrane potential, membrane resistance and capacitance for control and hPMCA2w/b groups. Data in H, J and N were assessed by Student’s t or Mann-Whitney tests as appropriate; data in K were assessed by Two-way ANOVA tests. The average data are shown as mean ± SEM. In some cases, the bars used to represent SEM are smaller than the symbol for the mean.

