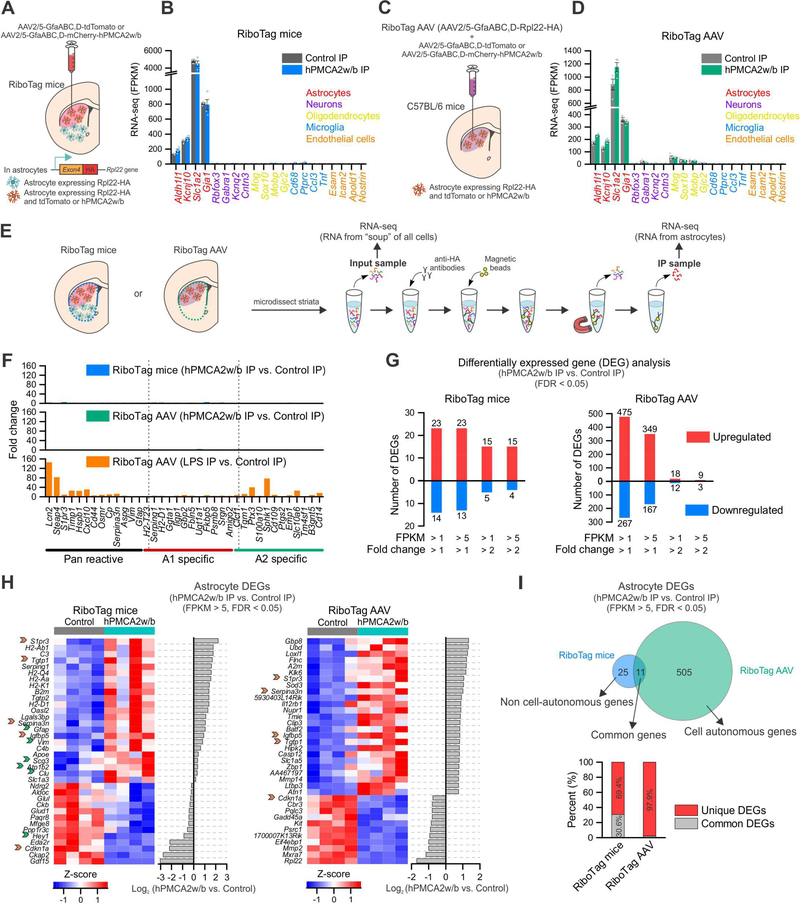
Figure 7: Ca2+ attenuation by hPMCA2w/b changed gene expression in astrocytes.
(A) RiboTag mice were crossed with Aldh1l1-cre/ERT2 mice to generate offspring expressing Rpl22HA in astrocytes (green cells in the cartoon). Control or hPMCA2w/b AAVs were injected into the dorsolateral striatum to target astrocytes (red cells). Astrocyte RNA from the whole striatal tissue was extracted; sequencing of IP and input material was performed (“RiboTag mice”). (B) Expression levels (in fragments per kilobase per million; FPKM) of cell-specific markers from RiboTag mice IP samples (n = 4 mice). (C) C57BL/6 mice received AAVs for Rpl22HA (“RiboTag AAV”) together with control or hPMCA2w/b AAVs in the dorsal lateral striatum (red cells). RNA from whole striatal tissue was extracted for IP of Rpl22HA: sequencing of IP and input material was performed (“RiboTag AAV”). (D) Expression levels of cell-specific markers in RiboTag AAV IP samples (n = 4 mice). (E) Schematic of the protocol used. (F) Fold-change of pan reactive, A1 and A2 astrocyte specific markers between hPMCA2w/b IP and control IP samples in RiboTag mice (top) and RiboTag AAV (middle). As a positive control, i.p. injection of LPS (5 mg/kg) was used. (G) Differentially expressed gene (DEG) analysis (limmaVoom, FDR < 0.05) showing the numbers of up- and down-regulated astrocyte genes between hPMCA2w/b IP and control IP in RiboTag mice and RiboTag AAV datasets. These analyses were restricted to genes with >2-fold enrichment in the IP compared with the input, and the plots show different threshold criteria. (H) Heatmaps of the top 36 astrocyte DEGs as ranked by differential expression log2 ratio between hPMCA2w/b IP and control IP (FPKM > 5). Orange arrows indicate genes that were common in the top 36 DEGs for both RiboTag mice and RiboTag AAV. Green arrows indicate additional DEGs in RiboTag mice that were also astrocyte DEGs in RiboTag AAV, but not in the top 36 for the latter. (I) Top, Venn diagram representing DEGs (FPKM > 5) in astrocytes from RiboTag mice and RiboTag AAV revealing putative cell autonomous genes and non cell-autonomous genes. Bottom, percent of unique astrocyte DEGs and common astrocyte DEGs between RiboTag mice and RiboTag AAV. Average data are shown as mean ± SEM. All RNA-seq data were for 4 separate replicates.

