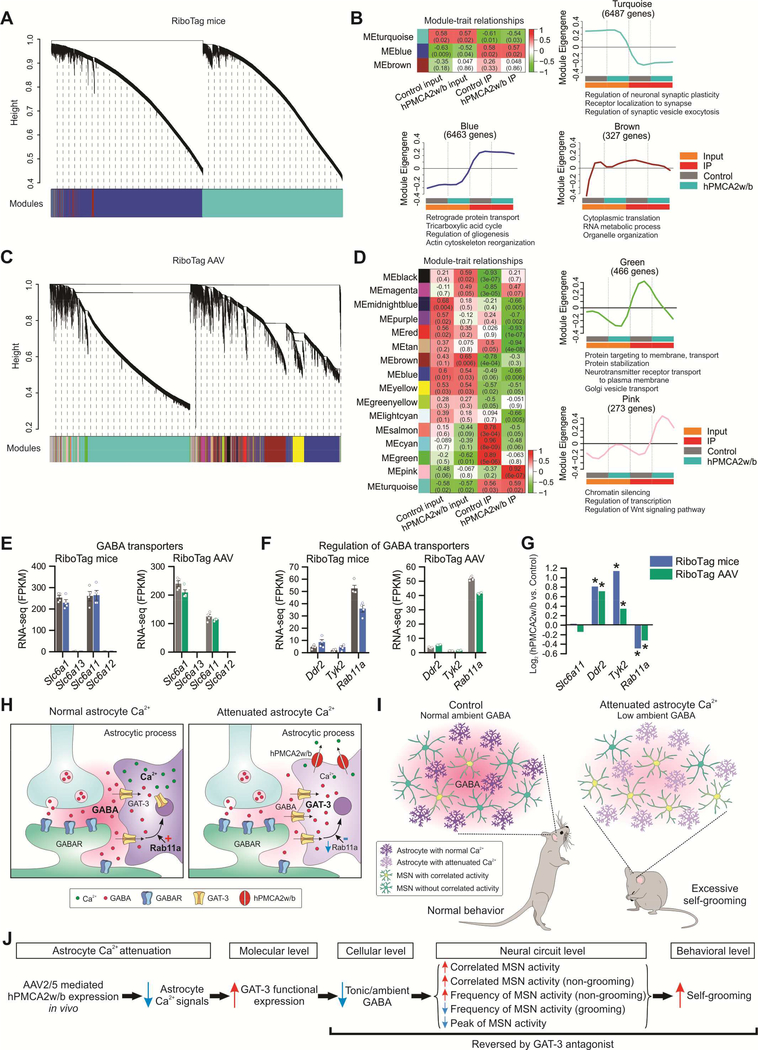
Figure 8: Weighted gene co-expression network analysis (WGCNA) identified distinct modules of co-expressed genes associated with attenuated astrocyte Ca2+ signaling.
(A) Hierarchical cluster dendrogram with colors underneath denoting three distinct modules of co-expressed transcripts in RiboTag mice RNA-seq data. (B) Heat map showing module-trait relationships, each row representing a module. Correlation coefficients between a Module Eigengene (ME) and trait (coded from −1 to 1) and corresponding P values are shown in each cell. The color indicates the level of correlation (positive correlation in red and negative correlation in green). Individual plots showing the expression of the module Eigengene across sample categories with significantly enriched terms for biological processes revealed by gene ontology enrichment analysis (FDR < 0.05). (C) Cluster dendrogram identified 16 co-expressed WGCNA modules for RiboTag AAV RNA-seq data. (D) Module-trait relationships revealed modules correlated with hPMCA2w/b expression in striatal astrocytes. Green module was composed of genes regulating protein transport, which were down-regulated in striatal astrocytes expressing hPMCA2w/b. Pink module was enriched in genes regulating chromatin silencing and transcription, which were upregulated in striatal astrocytes expressing hPMCA2w/b. (E) Expression levels of GABA transporters: Slc6a1 (GAT-1), Slc6a13 (GAT-2), Slc6a11 (GAT-3) and Slc6a12 (GAT-4) in RiboTag mice and RiboTag AAV RNA-seq data sets. (F) Expression levels of potential GABA transporter regulators suggested by previous work in RiboTag mice and RiboTag AAV RNA-seq data. (G) Changes in gene expression of striatal astrocytes expressing hPMCA2w/b, expressed as log2 (fold-change), in RiboTag mice and RiboTag AAV RNA-seq data. Asterisk (*) indicates differential expression between hPMCA2w/b IP and control IP using edgeR analysis on combined RNA-seq datasets (FDR < 0.1). (H-I) Cartoon summary of the main findings at synaptic (H) and in vivo levels (I). (J) Descriptive model based on our work (see discussion). Average data shown as mean ± SEM from 4 mice in each group.

