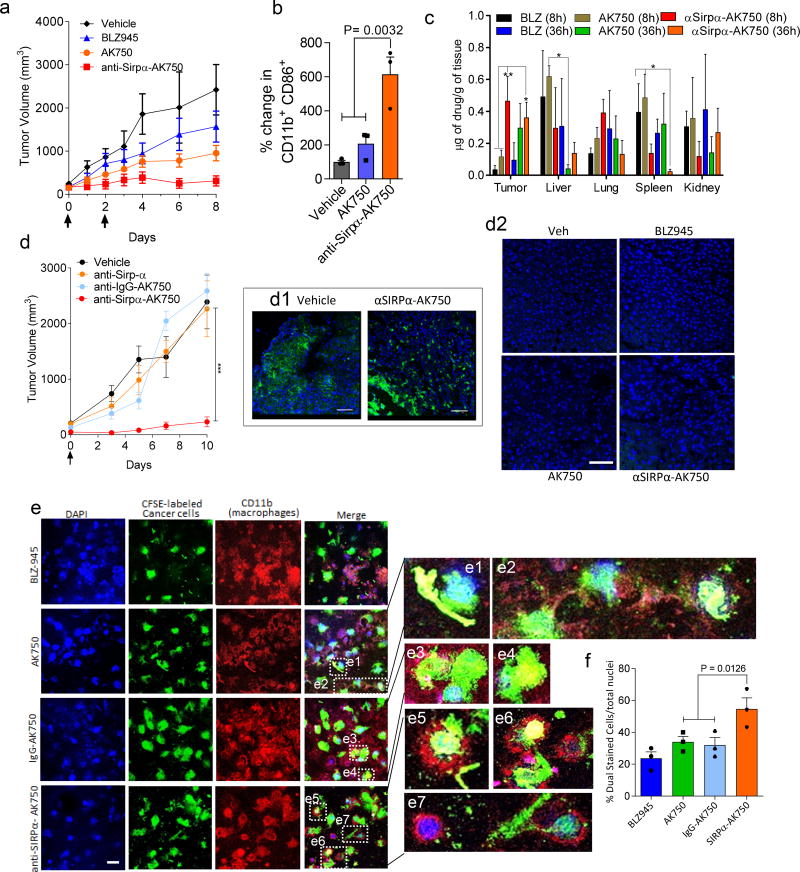
Fig.6. Single dose of anti-SIRPα-AK750 abrogates tumor growth in a syngeneic B-16/F10 melanoma C57BL/6 mouse model.
(a) Tumor growth curves show effect of two cycles of treatments on tumor volume in a syngeneic B-16/F10 melanoma C57BL/6 mice model. Animal with 75 mm3 tumors were randomized into four treatment groups: (1) vehicle controls, (2) BLZ945 (45mg/kg, i.p.), (3) AK750 (mole equivalent to BLZ945 dose), and (4) anti-SIRPα-AK750 (at mole equivalent to BLZ945 dose). One should note the different routes of administration, and i.p. administration can result in lower bioavailability than i.v. administration. First day of treatment was considered as Day 0. Data shown are mean ± SEM (n = 5), *p < 0.05 (One-way ANOVA). (b) Graphs show the quantification of expression M1 markers (CD11b+CD86+) in single cell suspension of the harvested tumor post-treatment, as quantified using flow cytometry. Tumors were harvested on day 10 and single cell suspension was prepared. Data shown are mean ± SEM (n = 3), P value is shown in the graph (One-way ANOVA). (c) Graph shows quantitative analysis of drug biodistribution in different organs. Major RES organs were excised from tumor-bearing mice at different time points after a single injection of AK750, anti Sirpα-AK750 and BLZ945. (all animals were dosed with drugs at molar equivalent to 15mg/kg dose of BLZ945, administered I.V.). The drug concentrations per gram of tissue were quantified using LC/MS/MS. Error bars represent mean ± SEM (n=3) (One-way ANOVA). (d) Tumor growth curves show effect of a single cycle of treatment on tumor volume in a syngeneic B-16/F10 melanoma C57BL/6 mice model. Animal with 75 mm3 tumors were randomized into four treatment groups: (1) vehicle controls, (2) anti-SIRPα IgG (5mg/kg), (3) IgG-AK750 (equivalent to molar dose equivalent to 45mg/kg of BLZ945), and (4) anti-SIRPα-AK750 (at mole equivalent to AK750 dose used in group 3). Day of treatment was considered as Day 0. Data shown are mean ± SEM (n = 5), ***p < 0.001 (One-way ANOVA). (d1) Representative fluorescence images shows F4/80+ macrophages in cross-sections of tumor tissue from vehicle- and anti-SIRPα-AK750-treated groups. (d2) Cross sections of liver stained for apoptosis signal (TUNEL) show the absence of any toxicity signal. (e) Representative confocal images show the effect of different treatments on phagocytosis of B16/F10 melanoma cells in a co-culture assay with macrophages. RAW264.7 Cells were stimulated with IL4 to generate M2 phenotype, and then incubated with BLZ-945, AK750, IgG-AK750 or anti-SIRPα-AK750 or. After 12h incubation, CFSE-labeled B16/F10 melanoma cells were added to the culture, and incubated for 8h. Nuclei were stained with DAPI (blue), Macrophages were labeled with APC-anti-CD11b antibody. Images were captured using a confocal microscope at same magnification (bar=10 µm). (e1–e7) Zoomed images from corresponding merged images show CFSE-labeled cancer cells (green) being phagocytosed by macrophages (red). (h) Graph shows the percentage of phagocytosis as determined by measuring the percentage of dual stained cells (red and green) to total nuclei (blue). Data shown are mean ± SEM (n = 3), p value is shown in the graph (One-way ANOVA followed by Newman Keul’s post hoc test).

