
Fig. 1.
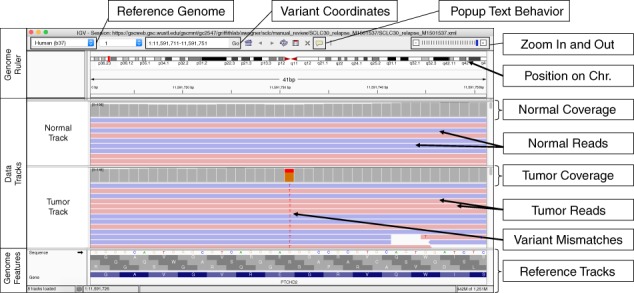
Example of the Integrative Genomics Viewer (IGV) interface with associated features relevant to manual review. The IGV interface is divided into three parts. The Genome Ruler details information about the genome assembly being visualized (Reference Genome), the coordinates currently being visualized (Variant Coordinates), and other navigation/display controls (e.g., Popup Text Behavior, Zoom In and Out, etc.). In this example, a portion of human chromosome 1 (build 37) is shown. The central section of IGV displays Data Tracks. In this case, short read DNA alignment data (e.g., BAM files) are shown for normal and tumor samples and are colored by read strand. Mismatches with the reference genome are highlighted by base: adenine (green), cytosine (blue), guanine (orange), and thymine (red). Coverage tracks summarize the total read depth at each base position. The Genome Features section shows the reference sequence itself, the amino acids for the three possible reading frames, and the gene associated with this locus (PTCHD2 in this example). The default gene track available with IGV is shown (RefSeq). Many other data formats and sources can be loaded as data tracks or genome features.