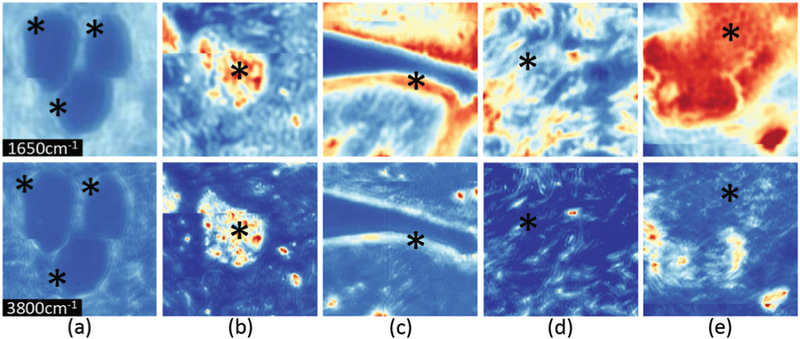
Fig. 2.

Spatial visual differences between different cell types. Cropped regions around pixels from HD cores (top row – band 1650 cm−1, bottom row – band 3800 cm−1) consisting of (a) adipocytes, (b) blood, (c) epithelium, (d) collagen, and (e) necrosis.
