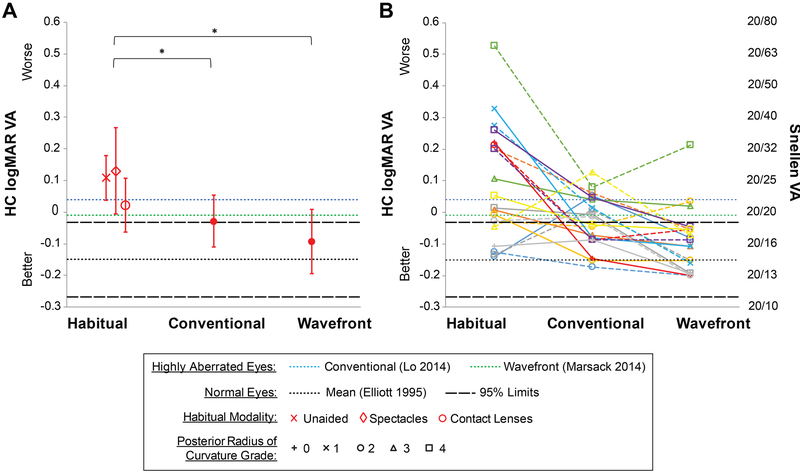
Figure 5.
High contrast (HC) logMAR visual acuity (VA) across the three corrections for (A) the mean of all eyes and (B) all individual eyes. Error bars are one standard deviation. In (B) two eyes of a subject are plotted in the same color; right eyes solid; left eyes dashed; symbols indicate severity grade of posterior radius of curvature.33 Age-matched 95% limits for normal eyes (Elliott et al.45) are plotted as well as levels for eyes with keratoconus wearing conventional (Lo et al.47) and wavefront-guided scleral lenses (Marsack et al.16).

