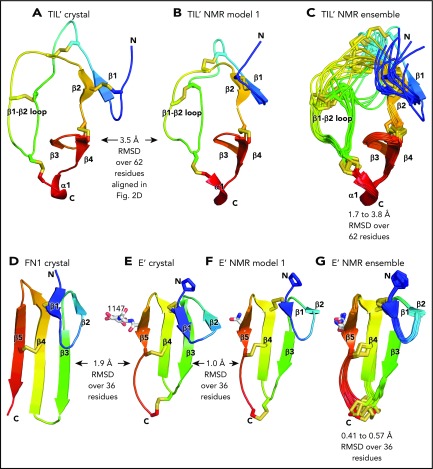
Figure 4.
Comparisons of TIL and E modules. (A-G) Each module is shown rainbow-colored to trace the path the polypeptide takes to create the fold, from N terminus (blue) to C terminus (red). Structural differences between modules are shown as RMSD of Cα atoms. Within NMR ensembles, the RMSD ranges are between model 1 and models 2 to 10. Other representations are as in Figure 1. Superposition was with the Deep Align server.27 Protein Data Bank ID codes are 2MHP (D′ NMR structure) and 3MQL (sixth fibronectin type I domain of fibronectin).

