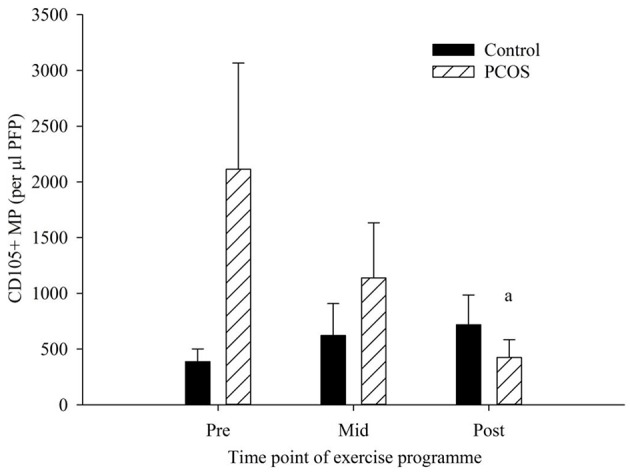
Figure 2.

CD105+ MP in control (dark bars) and PCOS (hatched bars) participants at pre, mid, and post-exercise intervention. Data represented as the concentration of CD105 + MP per μl PFP (means ± SEM). aSignificantly different compared to pre in PCOS group (p = 0.025). Error bars represent mean ± SEM.
