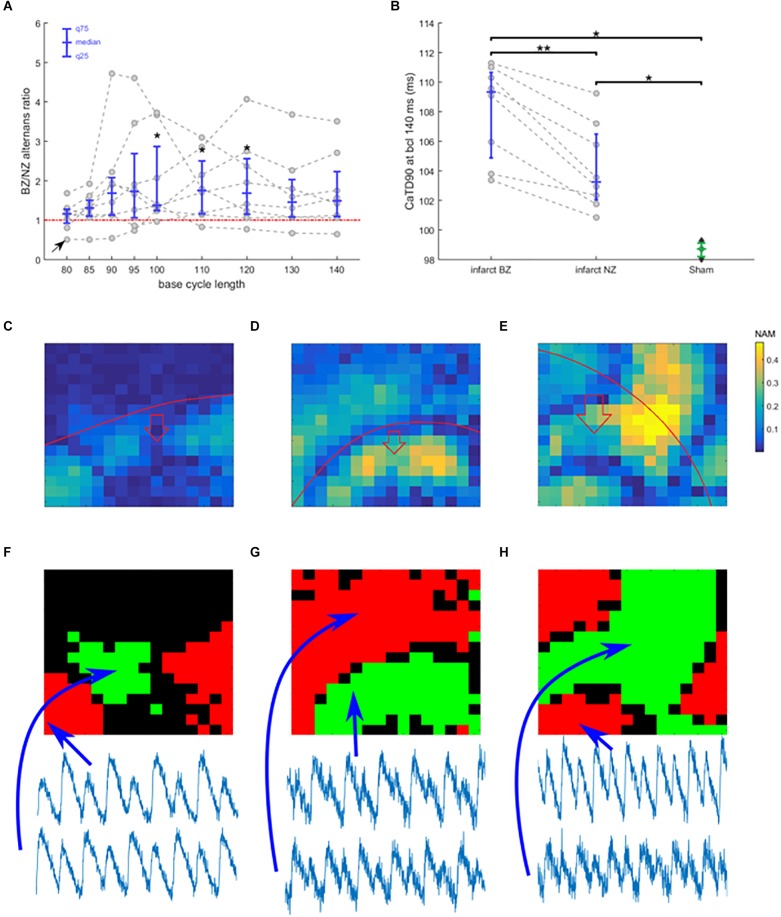
FIGURE 4.
Border zone vulnerability to alternans. (A) The ratio of alternans magnitude in border zone and non-infarcted zone of each recording, plotted as gray points against base cycle length (bcl). Data from a single heart are connected with a dashed line. In blue is given the median and 25 and 75 quantiles. Points above the red line manifest more alternans in border zone than in non-infarcted zone. Asterisks represent statistical significance of alternans in non-infarcted zone versus border zone within each heart at the level of 0.05 (∗); assessed using the Wilcoxon signed rank test. The black arrow in bottom left corner indicates a special trace discussed further in the text. (B) Duration of calcium transient at 90% calcium recovery at bcl 140 in infarcted hearts (NZ, non-infarcted zone; BZ, border zone) and in sham hearts; dashed lines connect data from the same heart. Asterisks represent statistical significance of difference between sham and infarcted hearts at the level of 0.01 (∗∗) or 0.05 (∗); the Wilcoxon signed rank test was used for comparing BZ and NZ, given the paired nature of data, while for the other two comparisons, Mann–Whitney U test was used. (C) An example of spatially heterogeneous alternans restricted to BZ. The color in each pixel denotes normalized alternans magnitude (NAM). (D) An example of nodal line passing along the edge of BZ. (E) An example of nodal line pattern with no obvious relationship to BZ edge. In (C–E), the red line marks the edge of the BZ, with the red arrow showing which side of the red line contains BZ. Subfigures (C–E) come from different hearts. (F–H) Maps of alternans phase in (C–E) (green and red zones represent zones of alternans oscillating in an opposite phase; black zones manifest no alternans). Below the phase maps are shown temporally aligned traces from different zones, verifying the discordance.

