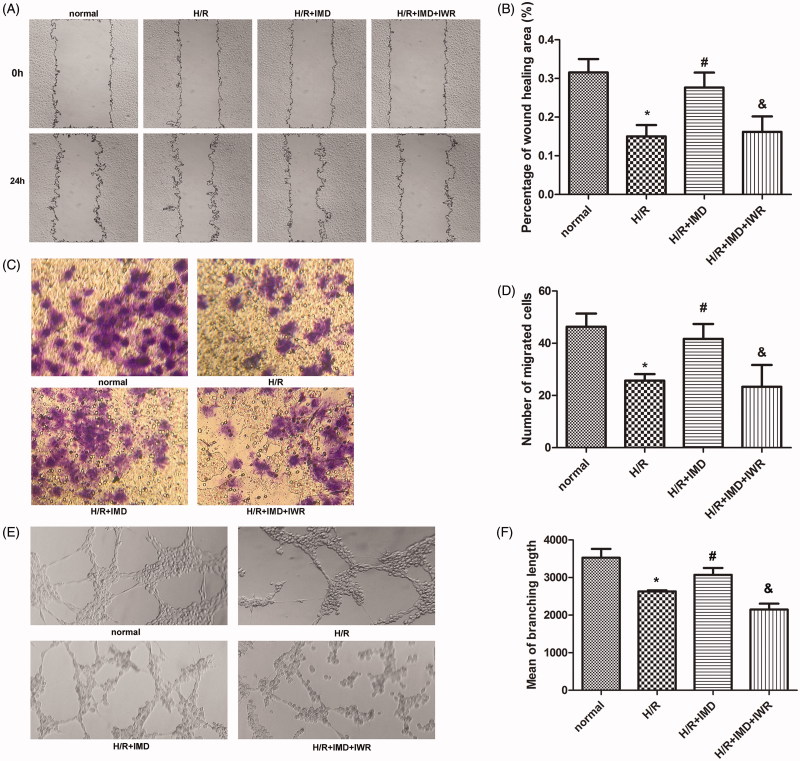
Figure 2.
IMD promotes HUVEC migration and tube formation in vitro. (A) HUVECs in each group were scraped with 10 μl sterile plastic tips, then the images were captured at 0 and 24 h (×100 magnification). (B) Histogram shows the percentage of wound healing area (n = 5). Wound areas were determined by Image J. (C) Transwell migration assays were photographed after 24 h using an optical microscope (×200 magnification). (D) Histogram shows the number of migrated cells (n = 3). [In (B,D) *p < .01 vs. control, #p < .01 vs. H/R group, &p < .01 vs. H/R + IMD group]. (E) After 12 h HUVECs formed network structures on matrigel coated plates. Structures were observed using a light microscope (×100 magnification). (F) Histogram shows the mean of branching length in each group (n = 3, *p < .01 vs. control, #p < .05 vs. H/R group, &p < .01 vs. H/R + IMD group). Each bar represents the mean ± SD.

