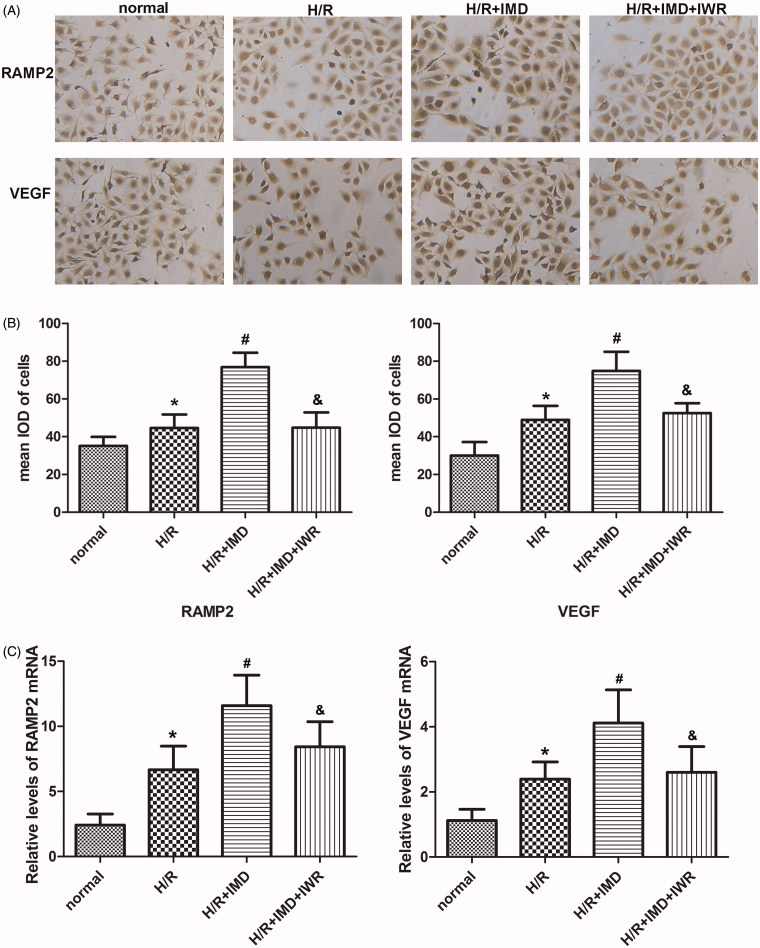
Figure 3.
IMD influenced the expression of vascular molecules. (A) HUVECs were stained with RAMP2 antibody and VEGF antibody, then visualized by DAB under a light microscope (×100 magnification). (B) Histogram shows the mean IOD of cells. Each bar represents the mean ± SD (n = 5, *p < .01 vs. control, #p < .01 vs. H/R group, &p < .01 vs. H/R + IMD group). (C) Histogram shows the relative levels of RAMP2 and VEGF mRNA in each group. Each bar represents the mean ± SD (n = 5, *p < .01 vs. control, #p < .01 vs. H/R group, &p < .01 vs. H/R + IMD group).

