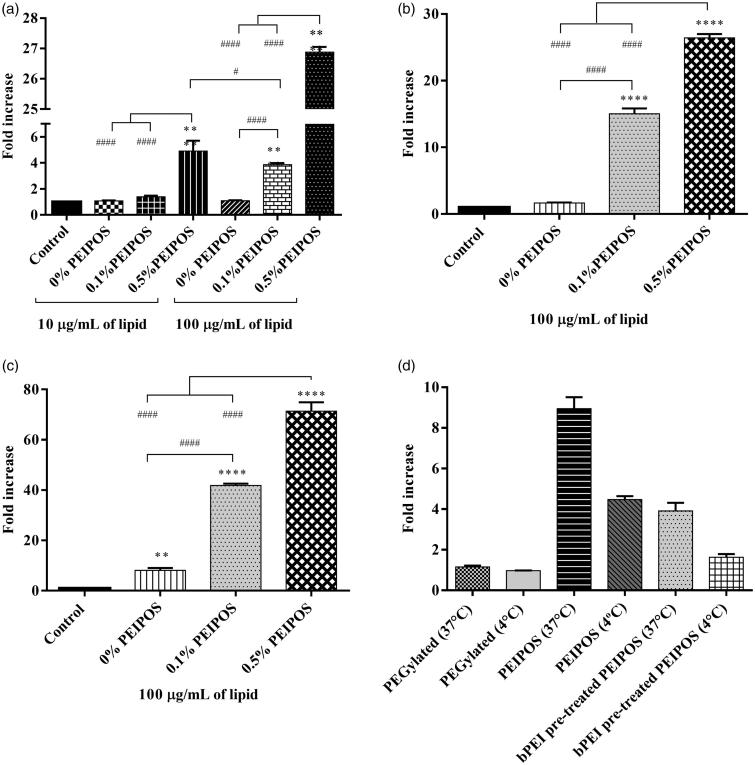
Figure 2.
Cellular association of coated and noncoated PEIPOS with monolayers of three different cancer cell lines; (a) HeLa, (b) A2780-ADR, and (c) SKOV-3TR. Lipid concentration used for each cell line is indicated below each graph and incubation time was 4h. Control groups are nontreated cells. * indicates difference from control, whereas # indicates differences within the groups. Mean ± SD, n = 3, **p < .001, ****p < .0001. One-way ANOVA with Tukey’s multiple comparisons test. (d) Mode of internalization by A2780-ADR cells by flow cytometry. Lipid concentration was 100 µg/mL and incubation time was 90 min. PEGylated liposomes were modified with 3 mol% PEG2000-PE. Results are given as the fold-increase over the nonfluorescently labeled control formulations.

