Figure 3.
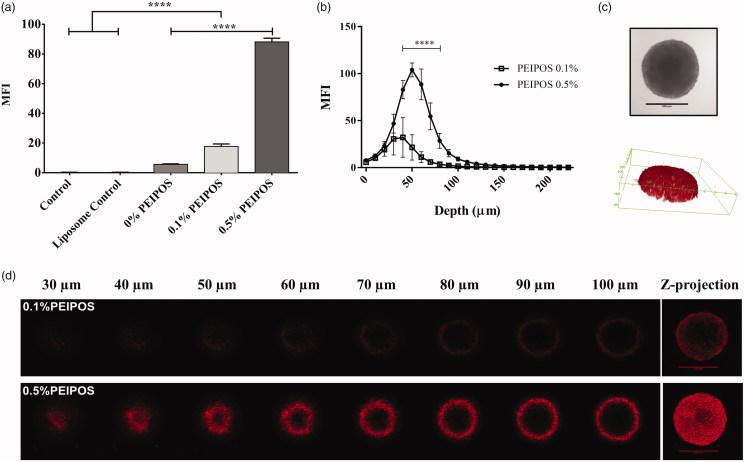
Kinetics of cellular association and penetration of formulations in 3D HeLa spheroids. (a) Rhodamine intensity increase as the indicator of cellular association of liposomes with HeLa cells after disassociation of spheroids into single cells, obtained by flow cytometry analysis. Control groups are nontreated cells, while control liposomes are cells treated with nonlabeled liposomes. n = 3, a total of 15 spheroids, mean ± SD, one-way ANOVA with Tukey’s multiple comparison tests, ****p < .0001. (b) Corrected integrated pixel density values of rhodamine vs. optical section depth as a representation of liposome distribution throughout the spheroids. n = 5, mean ± SD, two-way ANOVA with Sidak’s multiple comparisons, ****p < .0001. (c) A representative HeLa 3D spheroid incubated with 0.5% PEIPOS formulation, imaged by CLSM PMT. Scale bar indicates 500 µm. The 3D reconstruction of the same spheroid using rhodamine intensity confirmed the spheroidal shape of the 3D cell model. (d) Rhodamine-labeled liposome penetration into the spheroids at different layers of depth. The Z-projection was obtained using maximum pixel intensity collected from each layer of the spheroid. MFI, mean fluorescence intensity. Scale bars = 500 µm.

