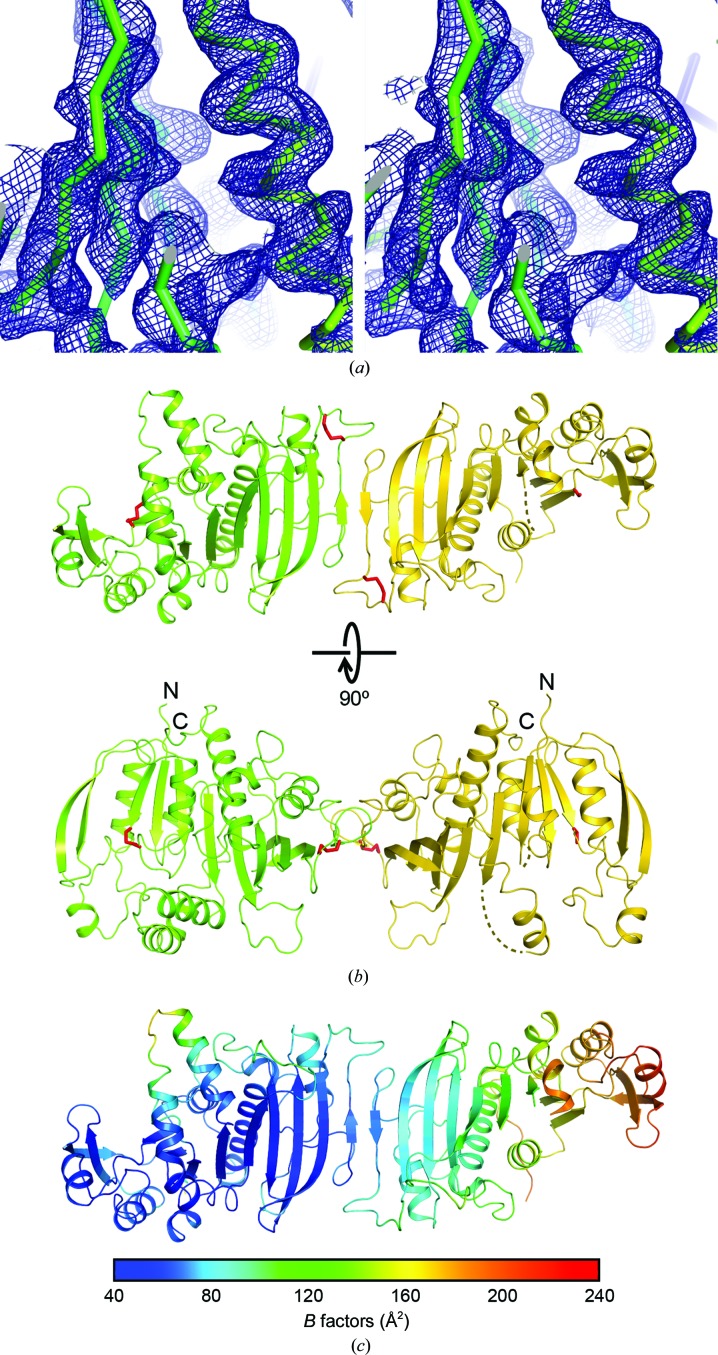
Figure 3.
Crystal structure of Syn6301-PRK. (a) Stereo representation of a portion of the experimental electron-density map calculated with osmium SAD-derived phases after density modification with SHELXE (Sheldrick, 2010 ▸). Electron density is depicted as a blue mesh at 1.5σ. The protein backbone is shown as a Cα trace. All structural figures were drawn with PyMOL (v.2.0; Schrödinger). (b) Perpendicular views of the asymmetric unit in the Syn6301-PRK crystal structure. PRK chains A and B are shown as green and yellow ribbons, respectively. Disulfide bonds are represented as red sticks. Disordered regions are indicated by dotted lines. The N- and C-termini are indicated. (c) B-factor distribution in the asymmetric unit. Increasing B factors are represented as a rainbow colour gradient from blue to red.

