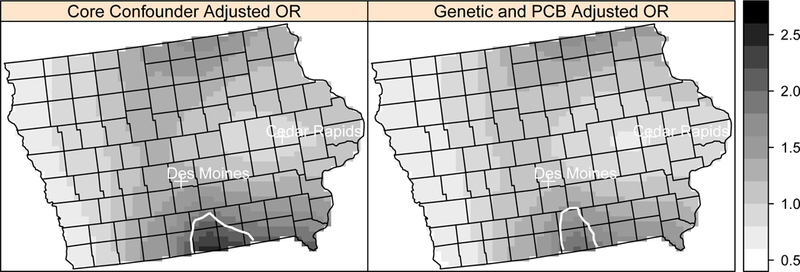
Figure 2.

Local odds ratios (OR, scale at right) for NHL adjusted for the core confounders and additionally for four genetic polymorphisms and PCB 180 at a residential lag time of 20 years in the Los Angeles study area using the model with missing variable coding. Areas of statistically significant elevated odds ratios are identified with a solid white line and statistically significant lowered odds ratios are identified with a dashed black line.
