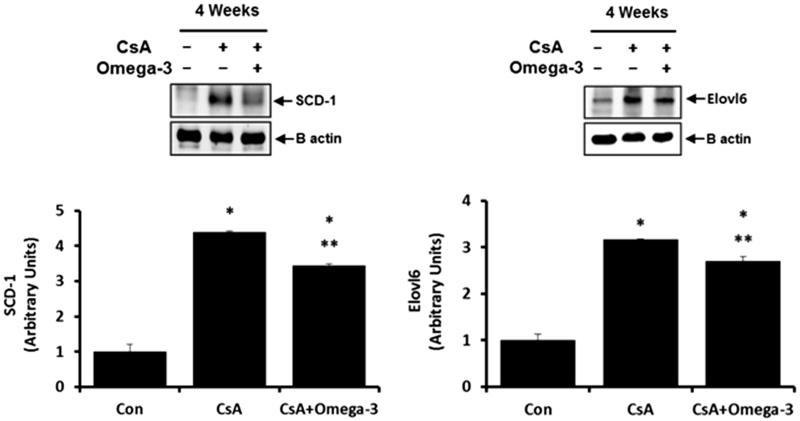
Figure 3.
SCD-1 and Elovl-6 expression in liver of cyclosporine induced rat. Compared with the control group, SCD-1 and Elovl-6 expressions were increased in liver of cyclosporine group and omega-3 FA reversed these effects in western blotting. *p < .05, compared to control group, **p < .05, compared to cyclosporine group.

