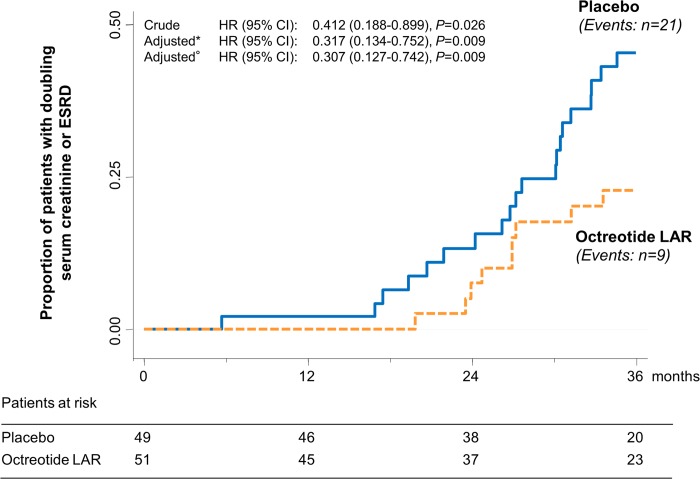
Fig 3. Kaplan–Meier curves for the secondary composite endpoint of doubling of serum creatinine or ESRD.
Kaplan–Meier curves show the proportion of patients who reached the composite endpoint of doubling of serum creatinine or ESRD in the placebo and octreotide-LAR groups during the 3-year study period. *Adjusted by age, sex, and baseline serum creatinine.°Adjusted by age, sex, and baseline serum creatinine and total kidney volume. ESRD, end-stage renal disease; HR, hazard ratio; octreotide-LAR, octreotide long-acting release.

