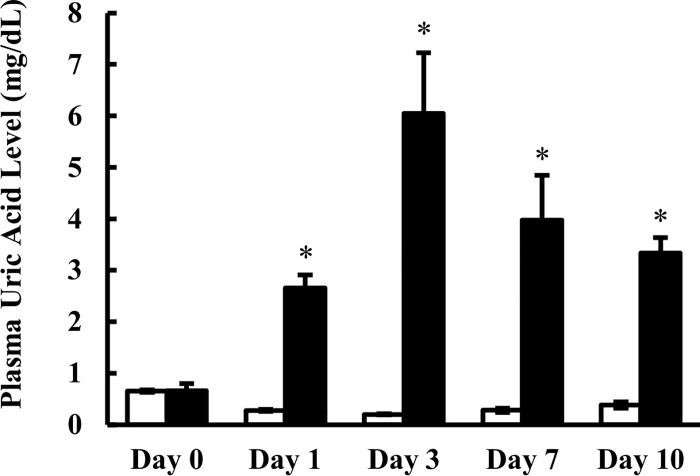
Fig 1. Plasma concentration of uric acid in control rats and oxonic acid plus adenine-treated rats during the 10-day administration period.
Plasma was collected 3 h after oral administration of oxonic acid and adenine at doses of 1.5 g/kg and 0.1 g/kg, respectively. Open and closed columns represent control and oxonic acid and adenine-treated rats, respectively. Control rats were given vehicle alone (0.5% (w/v) methylcellulose solution). Data are presented as mean ± SEM (n = 3–7). *p < 0.05 vs. control rats.

