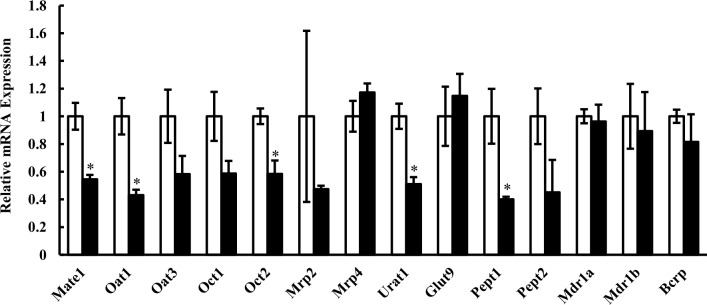
Fig 2. Relative mRNA expression levels of transporters in kidney of control and hyperuricemic rats.
Relative mRNA levels normalized to Gapdh mRNA in hyperuricemic rats (closed columns) are shown as the ratio to those in control rats (open columns). Data are presented as mean ± SEM (n = 3–7). *p < 0.05 vs. control rats.

