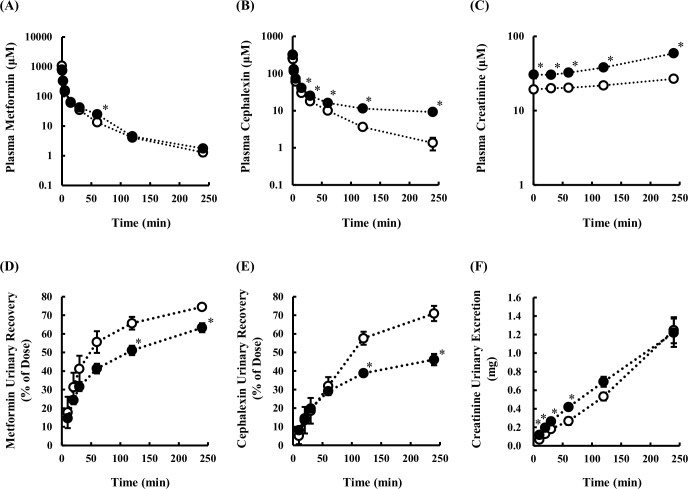
Fig 3.
Plasma concentration-time profiles of metformin (A), cephalexin (B) and creatinine (C) and cumulative urinary excretions of metformin (D), cephalexin (E) and creatinine (F) in control (open circles) and hyperuricemic rats (closed circles). Concentrations of metformin, cephalexin and creatinine in plasma and urine were measured up to 4 h after intravenous administration of metformin (30 mg/kg) or cephalexin (10 mg/kg). Creatinine concentration represents endogenous creatinine. Data are presented as mean ± SEM (n = 3). *p < 0.05 vs. control rats.

