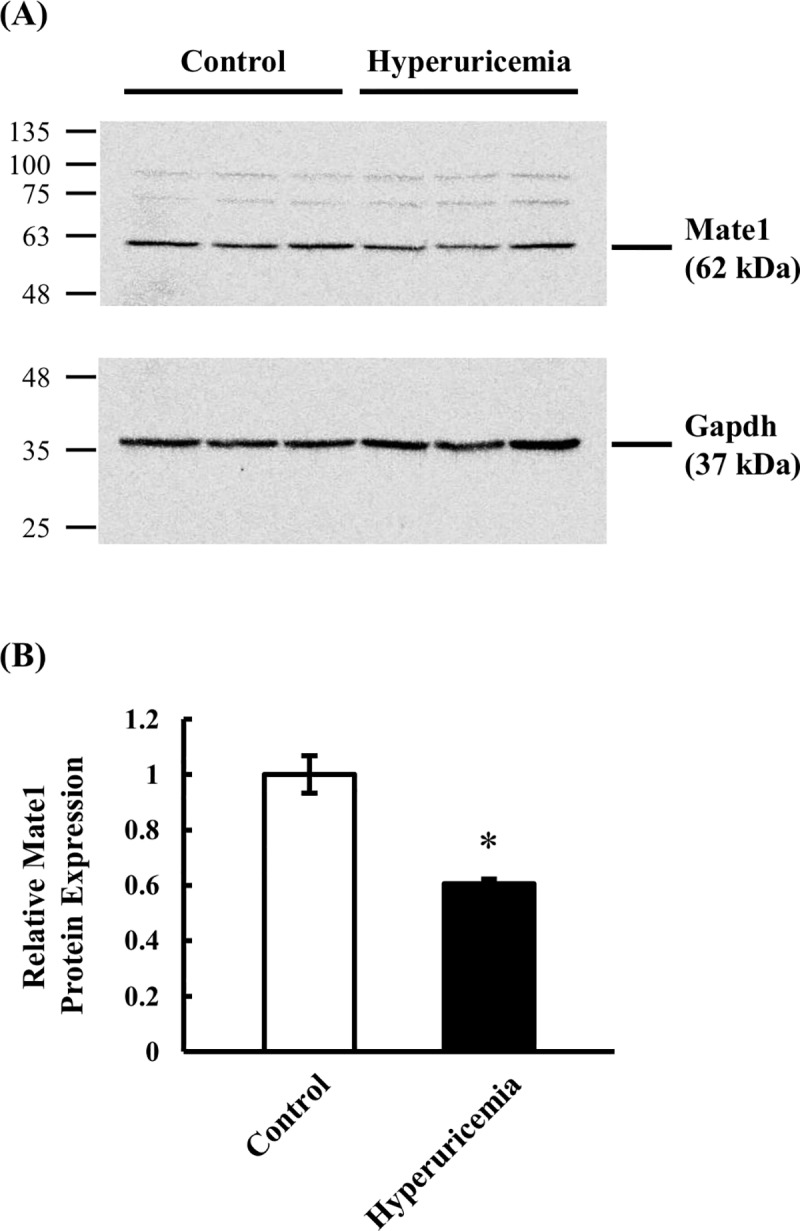
Fig 5. Protein expression level of kidney Mate1 in control and hyperuricemic rats.

Western blot analysis was conducted using whole kidney lysate. (A) Typical result detected with anti-Mate1 and anti-Gapdh antibodies on the same membrane is shown. (B) Relative Mate1 density normalized to Gapdh density in hyperuricemic rats (closed column) are shown as the ratio to those in control rats (open column). Data are presented as mean ± SEM (n = 3). *p < 0.05 vs. control rats.
