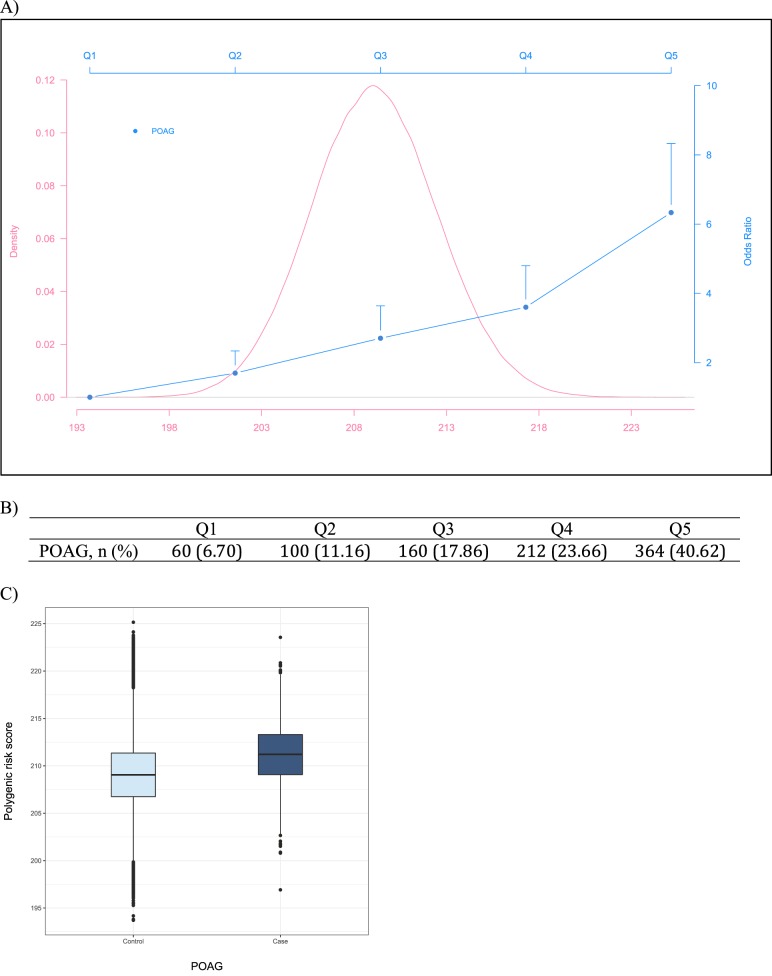
Figure 1.
Distribution of the weighted IOP PRS and association with POAG. (A) Distribution of the weighted PRS and ORs of POAG comparing each of the four upper quintiles with the lowest quintile, adjusting for age and sex. The vertical lines represent the upper 95% CI for each OR. (B) Number of POAG cases (percentage) in each category. (C) Boxplots of PRS for POAG cases and controls.

