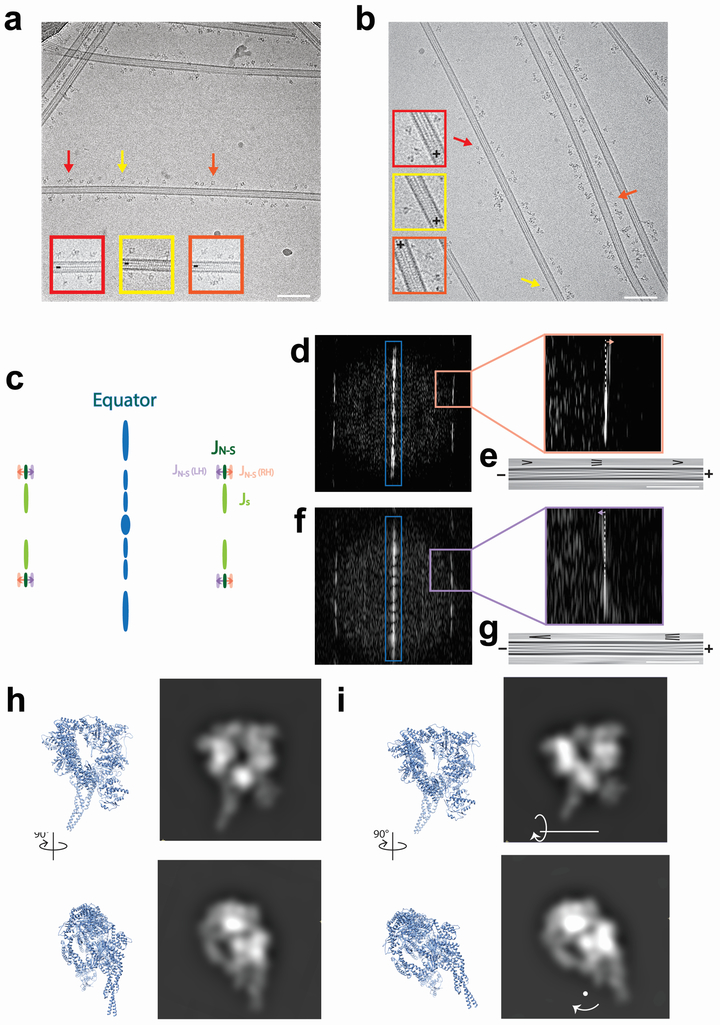
Extended Data Figure 7 ∣. CryoEM image analysis of dynein monomers on MTs.
a, A representative cryoelectron micrograph of Dyn monomers bound to MTs with single monomers indicated with arrows and enlarged inset (Scale bar = 100 nm). n = 98 micrographs from 1 grid for Dyn, and 235 micrographs from 2 grids for DynRK+7hep. b, A representative cryoelectron micrograph of DynRK+7hep monomers bound to MTs with single monomers indicated with arrows and enlarged inset (Scale bar = 100 nm). c, A simplified depiction of the power spectrum of a MT as a method to determine MT polarity. MTs with different numbers of protofilaments have different degrees of protofilament skew around the long-axis. This causes differences in the Moiré patterns produced in cryoEM images. These visual changes result in changes to the position of certain reflections in the MT power spectrum. As a result, right- and left-handed helix architectures can be differentiated by the relative positions of the JS (light green) and JN-S (dark green) reflections. For right-handed helices, the JN-S (RH, pink) reflection is further from the equator (blue) than the JS reflection, whereas for left-handed helices the JN-S (LH, purple) reflection is closer to the equator than the JS reflection. When the MT is Fourier-filtered to only include information from the equator (blue), a characteristic arrowhead pattern is formed from the Moiré patterns. For right-handed helix architectures, this points towards the plus-end, and for left-handed helix architectures this points towards the minus-end. d, An example power spectrum of an MT determined to be a right handed-helix. Enlargement on the right shows that the JS reflection is closer to the equator than the JN-S reflection. e, A Fourier-filtered image produced from the equatorial reflections from the power spectrum in d (blue box). For right-handed helix architectures, the arrowheads point towards the plus end (Scale bar = 100 nm). f, An example power spectrum of an MT determined to be a left handed-helix. Enlargement on the right shows that the JS reflection is further from the equator than the JN-S reflection. g, A Fourier-filtered image produced from the equatorial reflections from the power spectrum in f (blue box). For left-handed helix architectures, the arrowheads point towards the minus end (Scale bar = 100 nm). h, Orthogonal views of an atomic model of a dynein motor in an arrangement corresponding to the “wild-type view”, and synthetic projections produced from them. In this arrangement, the motor appears as an even ring. i, As in h, but with the model tilted 30° around the indicated axis. In this arrangement, the projection creates a crescent shape similar to that seen in the DynRK+7hep class (Figure 2e), albeit with the ring and stalk unflipped, suggesting that the ring of DynRK+7hep is slightly tilted in relation to the MT.

