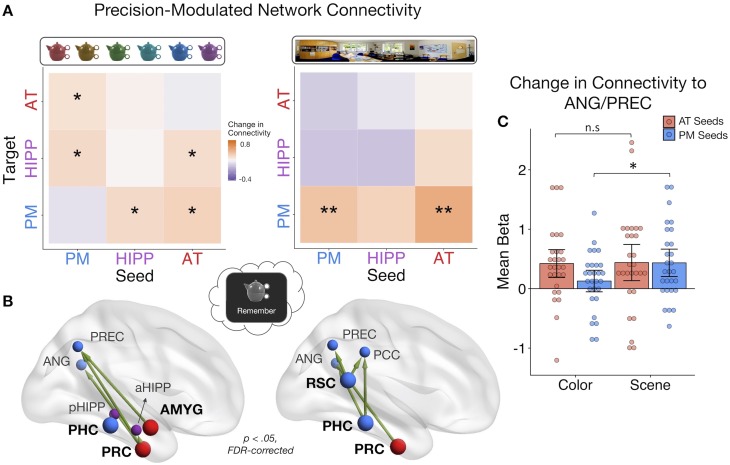
Figure 5. PMAT connections predicting the precision of item and spatial features in memory.
(A) Mean change in within- and between-network connectivity with increasing color memory precision (left) and spatial memory precision (right) during remember trials. **=p < 0.05, FDR-corrected; *=p < 0.05, uncorrected. (B) Individual seed-to-target connections whose connectivity strength tracks the precision of memory for color (left) and scene (right) information, including PRC and AMYG, sensitive to item and emotion information in the AT system, and PHC and RSC, sensitive to spatial information in the PM system. Depicted connections survive FDR-correction for all possible seed-to-target connections. Seed regions are shown as larger nodes, with bold labels. (C) Mean strength of precision-modulated connectivity changes to ANG/PREC for AT seeds (PRC and AMYG) and PM seeds (PHC and RSC), by feature ±95% CI. *=p < 0.05 (Figure 5—source data 1). Points = individual subject estimates.

