Figure 3. Rare conformational states of ligand-free SBPs.
(A) Schematic of the experimental strategy to study the conformational dynamics of ligand-free SBPs. Representative fluorescence trajectories of OpuAC(V360C/N423C) (B), PsaA(V76C/K237C) (C), MalE(T36C/S352C) (D), SBD1(T159C/G87C) (E), OppA(A209C/S441C) (F) and SBD2(T369C/S451) (G) in the absence of substrate. 10–20 μM of unlabeled protein or 1 mM EDTA (for PsaA) was added to scavenge any ligand contaminations. In all fluorescence trajectories presented in the figure: top panel shows calculated apparent FRET efficiency (blue) from the donor (green) and acceptor (red) photon counts as shown in the bottom panels. Orange lines indicate average apparent FRET efficiency value or most probable state-trajectory of the Hidden Markov Model (HMM). Statistics in Supplementary file 4. (H) Percentage of time a SBP is in the high FRET state. Statistics in Supplementary file 4.
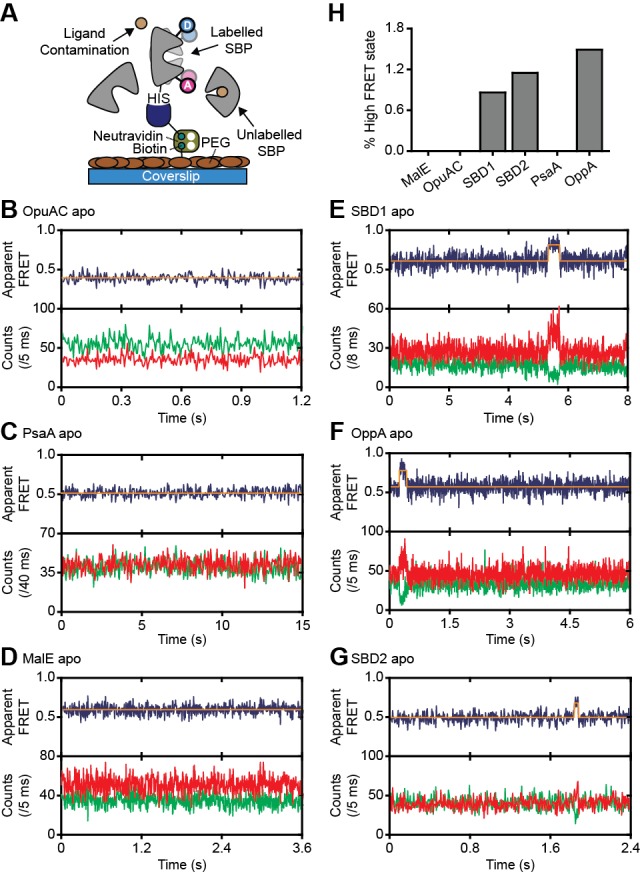
Figure 3—figure supplement 1. Conformational dynamics of ligand-free and ligand-bound SBPs.

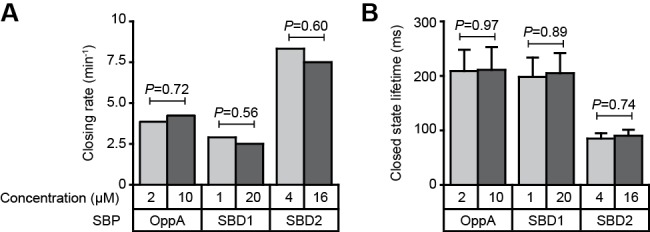
Figure 3—figure supplement 2. Intrinsic conformational dynamics in the presence of unlabeled protein.