. 2019 Mar 22;8:e44652. doi: 10.7554/eLife.44652

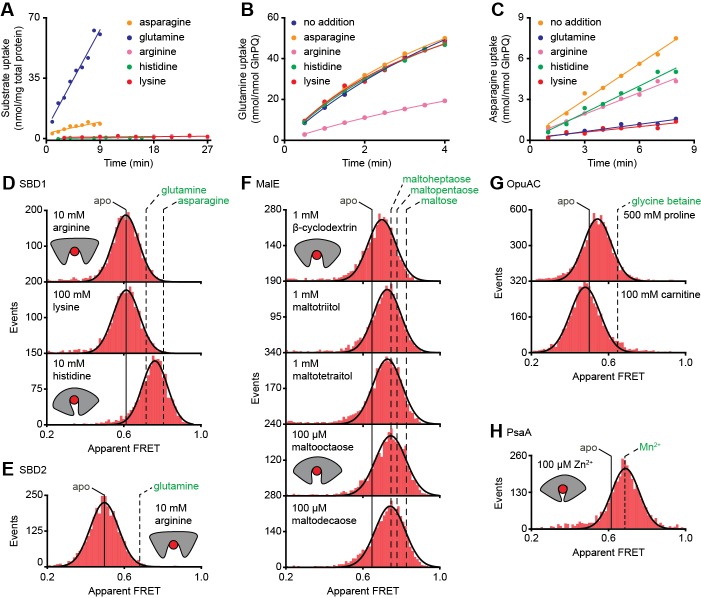
Figure 4. Substrate-specificity of GlnPQ and SBP conformations induced by non-cognate substrates.

(A) Time-dependent uptake [14C]-asparagine (5 μM), [14C]-glutamine (5 μM), [14C]-arginine (100 μM), [14C]-histidine (100 μM) and [3H]-lysine (100 μM) by GlnPQ in L. lactis GKW9000 complemented in trans with a plasmid for expressing GlnPQ; the final amino acid concentrations are indicated between brackets. Points are the data and the solid line a hyperbolic fit. Time-dependent uptake of glutamine (B) and asparagine (C) in proteoliposomes reconstituted with purified GlnPQ (see Materials and methods section). The final concentration of [14C]-glutamine and [14C]-asparagine was 5 μM, respectively; the amino acids indicated in the panel were added at a concentration of 5 mM. Solution-based apparent FRET efficiency histogram of SBD1(T159C/G87C) (D), SBD2(T369C/S451) (E), MalE(T36C/S352C) (F), OpuAC(V360C/N423C) (G) and PsaA(V76C/K237C) (H) in the presence of non-cognate (red bars) substrates as indicated. Bars are the data and solid line a Gaussian fit. The 95% confidence interval for the distribution mean is shown in Supplementary file 3. The interval center is indicated by vertical lines (solid and dashed).

Figure 4—source data 1. Apparent FRET efficiency histograms of Figure 4D–H.
DOI: 10.7554/eLife.44652.020

Figure 4.

Figure 4—figure supplement 1. Substrate binding of SBD1 and SBD2 studied by ensemble FRET.

Figure 4—figure supplement 1.

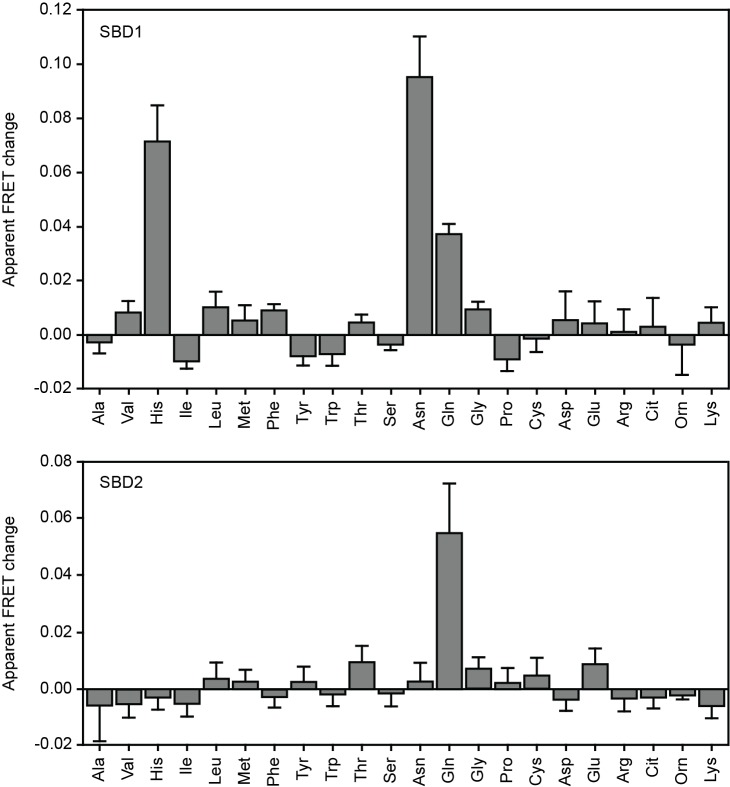
The mean apparent FRET change of SBD1 (top) and SBD2 (bottom) in the presence of 5 mM of the indicated amino acids relative to their absence; measurements were performed in 50 mM KPi, 50 mM KCl, pH 7.4. Amino acids are indicated by their three letter abbreviation. Data correspond to mean ± s.d. of the apparent FRET change of duplicate measurements with the same labeled protein sample.
Figure 4—figure supplement 2. Non-cognate substrate binding by SBD1 and SBD2.

Figure 4—figure supplement 2.

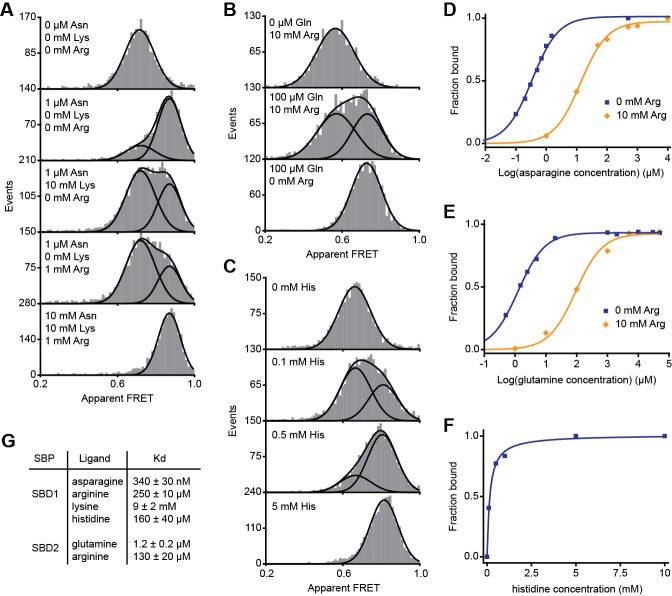
Solution-based apparent FRET efficiency histograms of SBD1(T159C/G87C) (A and C) and SBD2(T369C/S451) (B) in the presence of different ligand concentrations as indicated. Bars are the data and the solid lines a fit to a mixture model with two Gaussian distributions or a fit with a single Gaussian distribution. The mean of the Gaussian distributions was obtained from the extreme conditions and fixed in the mixture model. Fraction of SBD1 bound to asparagine (D), SBD2 bound to glutamine (E) and SBD1 bound to histidine (F). Points are the data and the solid line a fit to a one site-binding model. (G) Estimated dissociation constants KD as obtained from the fit. Error bars represent 95% confidence interval.
Figure 4—figure supplement 3. PsaA(E74C/K237C) conformational changes probed by smFRET.
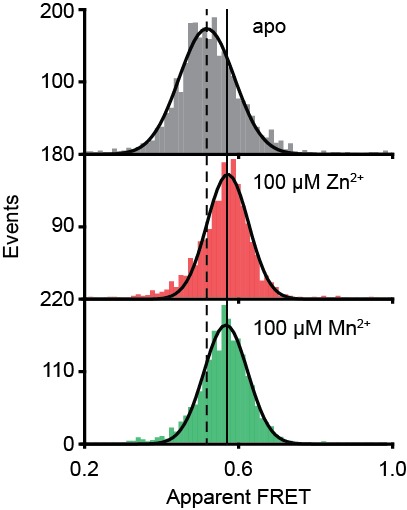
Figure 4—figure supplement 3.

Solution-based apparent FRET efficiency histogram of PsaA(E74C/K237C) in the presence and absence of metals as indicated. Bars are the data and solid line a Gaussian fit. The 95% confidence interval for the distribution mean is shown in Supplementary file 3. The interval center is indicated by vertical lines (solid and dashed).