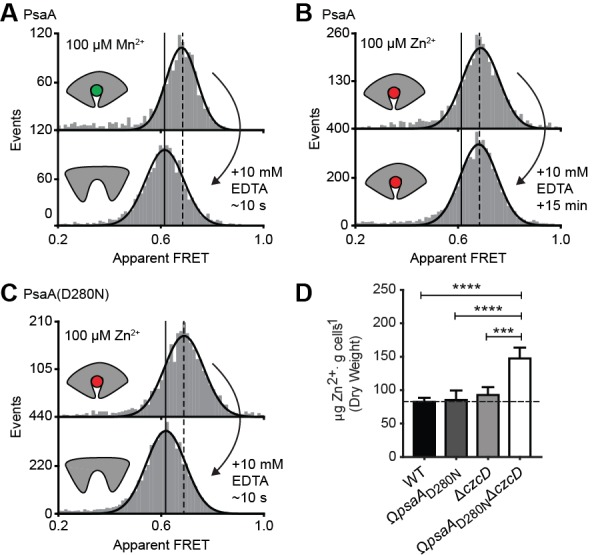
Figure 5. Opening transition in PsaA dictates transport specificity.

Solution-based apparent FRET efficiency histograms of PsaA(V76C/K237C) in the presence of Mn2+ (A) or Zn2+ (B) and PsaA(D280N) in the presence of Zn2+ (C) upon addition of 10 mM EDTA and incubated for the indicated duration. Bars are the data and the solid line a Gaussian fit. The 95% confidence interval for the mean of the Gaussian distribution can be found in Supplementary file 3, and the interval center is indicated by vertical lines (solid, metal-free and dashed, metal-bound). (D) Whole cell Zn2+ accumulation of S. pneumoniae D39 and mutant strains in CDM supplemented with 50 µM ZnSO4 as determined by ICP-MS. Data correspond to mean ± s.d. μg Zn2+.g−1 dry cell weight from three independent biological experiments. Statistical significance was determined by one-way ANOVA with Tukey post-test (***p < 0.005 and ****p < 0.0001).
