. 2019 Mar 22;8:e44652. doi: 10.7554/eLife.44652

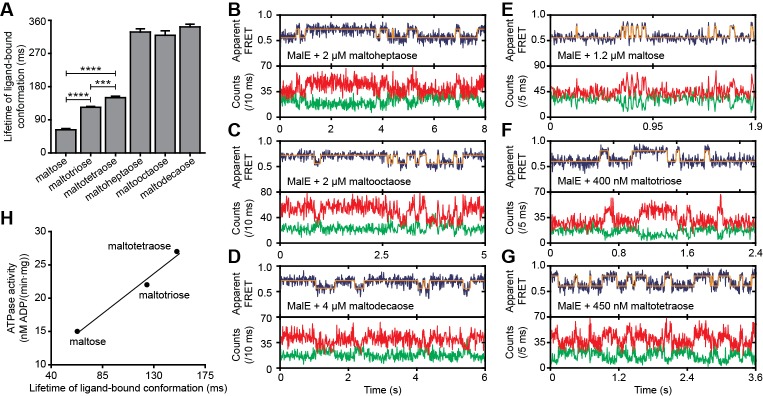
Figure 6. Lifetime of MalE ligand-bound conformations and relation to activity.

(A) Mean lifetime of the ligand-bound conformations of MalE, obtained from all single-molecule fluorescence trajectories in the presence of different maltodextrins as indicated. Data corresponds to mean ± s.e.m. Data in Figure 6—figure supplement 2. Statistical significance was determined by two-tailed unpaired t-tests (***p < 0.005 and ****p < 0.0001). (B, C, D, E, F and G) Representative fluorescence trajectories of MalE(T36C/S352C) in the presence of different substrates as indicated. In all fluorescence trajectories presented: top panel shows calculated apparent FRET efficiency (blue) from the donor (green) and acceptor (red) photon counts as shown in the bottom panels. Most probable state-trajectory of the Hidden Markov Model (HMM) is shown (orange). (H) Published ATPase activity (Hall et al., 1997a) linked to the lifetime of the closed MalE conformation induced by transport of different cognate substrates as indicated. Points are the data and the solid line a simple linear regression fit.

Figure 6—source data 1. Lifetimes of the high FRET state of the data shown in Figure 6A and Figure 6—figure supplement 2.
DOI: 10.7554/eLife.44652.026
Figure 6—source data 2. Donor and acceptor photon counts, apparent FRET efficiency and most probable state-trajectory of the Hidden Markov Model of the traces in Figure 6B–G.
DOI: 10.7554/eLife.44652.027
Figure 6—source data 3. Lifetimes of the high FRET state of the data shown in Figure 6—figure supplement 3B.
DOI: 10.7554/eLife.44652.028

Figure 6.

Figure 6—figure supplement 1. Surface-based smFRET histogram of MalE.
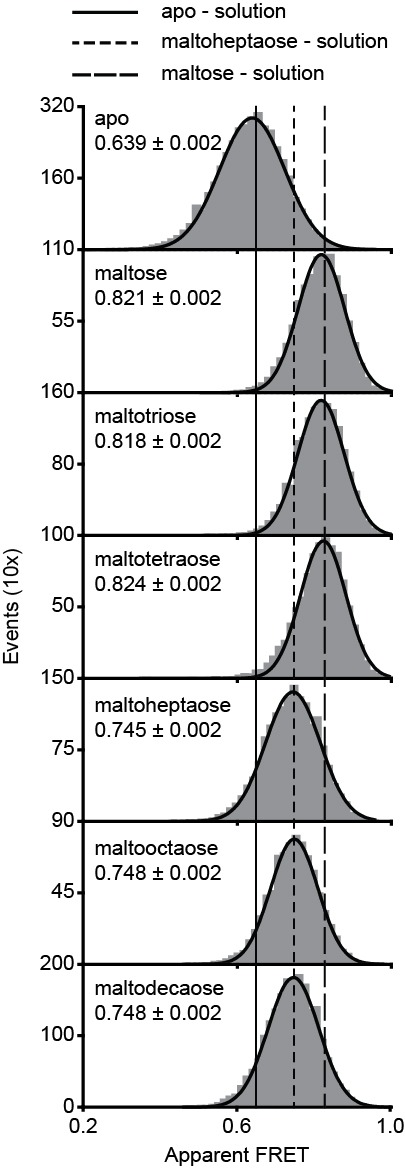
Figure 6—figure supplement 1.

(A) Surface-based apparent FRET efficiency histogram of MalE(T36C/S352C) in the presence of different maltodextrin substrates as indicated. From the probable state-trajectory of the Hidden Markov Model (HMM), the apparent FRET efficiencies of the low (ligand-free conformation) and high FRET state (closed ligand-bound conformation) were obtained. The final histogram was constructed from all fluorescence trajectories. Representative fluorescence trajectories are shown in Figure 6B–G. Bars are the data and solid line a Gaussian fit. The 95% confidence interval for the distribution mean is indicated. The average apparent FRET efficiency of the solution-based smFRET measurements (Figure 2—figure supplement 3A) is indicated by vertical lines.
Figure 6—figure supplement 2. Lifetime distribution of the ligand-bound conformations of MalE.
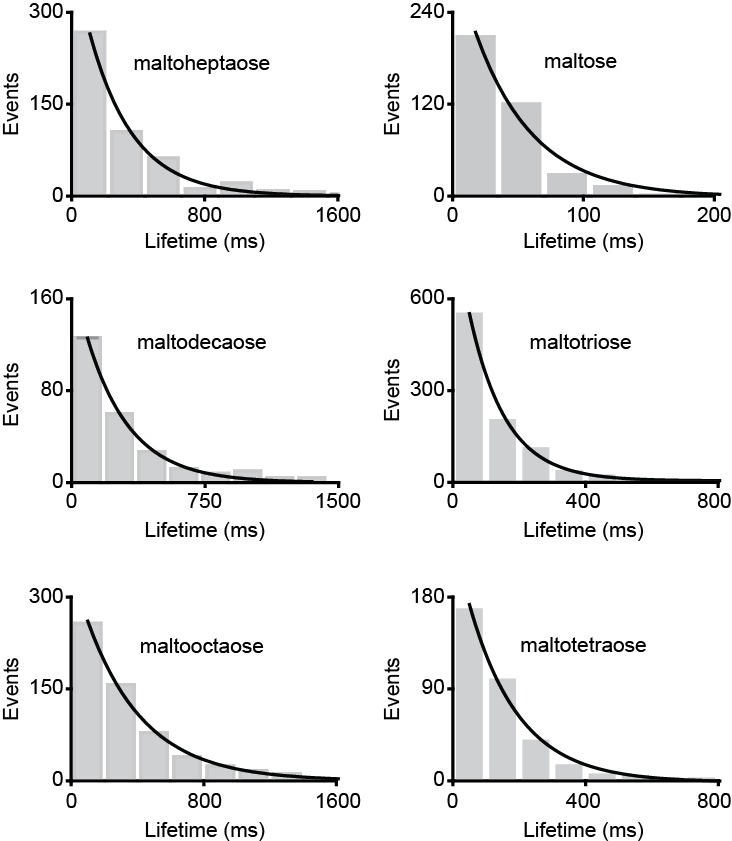
Figure 6—figure supplement 2.

Dwell time histogram of the high FRET (closed ligand-bound conformation) as obtained from the most probable state-trajectory of the Hidden Markov Model (HMM) of all molecules per condition as shown in Figure 6B–G. Grey bars are the data and the solid line an exponential fit. Statistics in Supplementary file 4.
Figure 6—figure supplement 3. Conformational changes and dynamics of MalE(A96W/I329W).
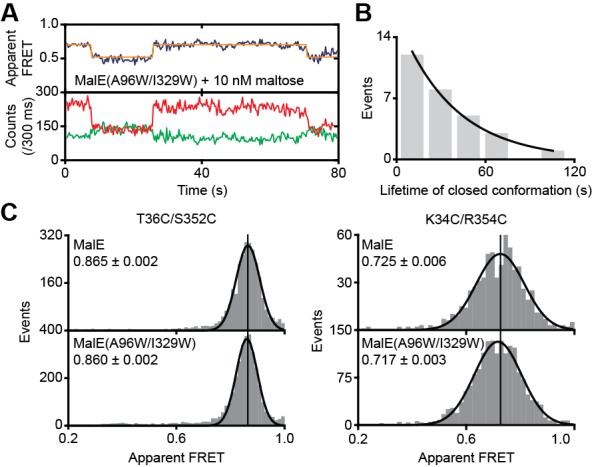
Figure 6—figure supplement 3.

(A) Representative fluorescence trajectories of MalE(T36C/S352C/A96W/I329W) in the presence of 10 nM maltose. Fluorescence trajectories: the top panel shows the calculated apparent FRET efficiency (blue) from the donor (green) and acceptor (red) photon counts as shown in the bottom panel. The most probable state-trajectory of the Hidden Markov Model (HMM) is shown (orange). (B) Dwell time histogram of the high FRET state (closed conformation) as obtained from the most probable state-trajectory of the HMM of all molecules. Grey bars are the data and the solid line is an exponential fit. Statistics in Supplementary file 4. (C) Solution-based apparent FRET efficiency histogram of MalE and MalE(A96W/I329W) in the presence of 1 mM maltose for the indicated inter-dye positions. Bars are the data and solid line a Gaussian fit. The 95% confidence interval for the mean of the Gaussian distribution is indicated. The FRET distributions of the wildtype and mutant protein are not significantly different; p = 0.28 (T36C/S352C) and p = 0.30 (K34C/R352) using the two-way KS test.