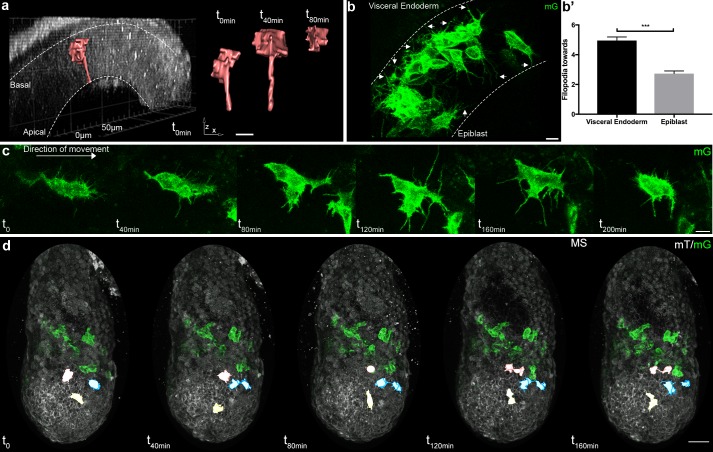
Figure 3. Cell shape changes of migrating mesoderm.
(a) Cell shape progression of nascent mesoderm delaminating at the primitive streak of a Mid Streak embryo (Z-projection of two-photon stack, scale bar: 10 μm). (b) Mesoderm cells extend filopodia (arrows) towards epiblast and visceral endoderm. Embryo is at Late Streak stage. (Z-projection of two-photon stack, scale bar: 10 μm). (b’) Quantification of filopodia per cell per time point as mean ± SEM, n=40 cells out of 4 Late Streak embryos for each, p<0.0001. P value was calculated using the t test. Data can be found in Figure 3—source data 1. (c) Montage of a mesoderm cell (from a Mid Streak stage embryo) displaying seeking behavior (Z-projection of two-photon stack, scale bar: 10 μm). (d) Mesoderm cells are highlighted, through manual segmentation, in red, blue and yellow to track cell behavior after division (Z-projection of confocal stacks from a Mid Streak stage embryo, anterior view, scale bar: 50 μm). mG: membrane GFP, in green; mT: membrane dtTomato, in grey.

